|
||
|
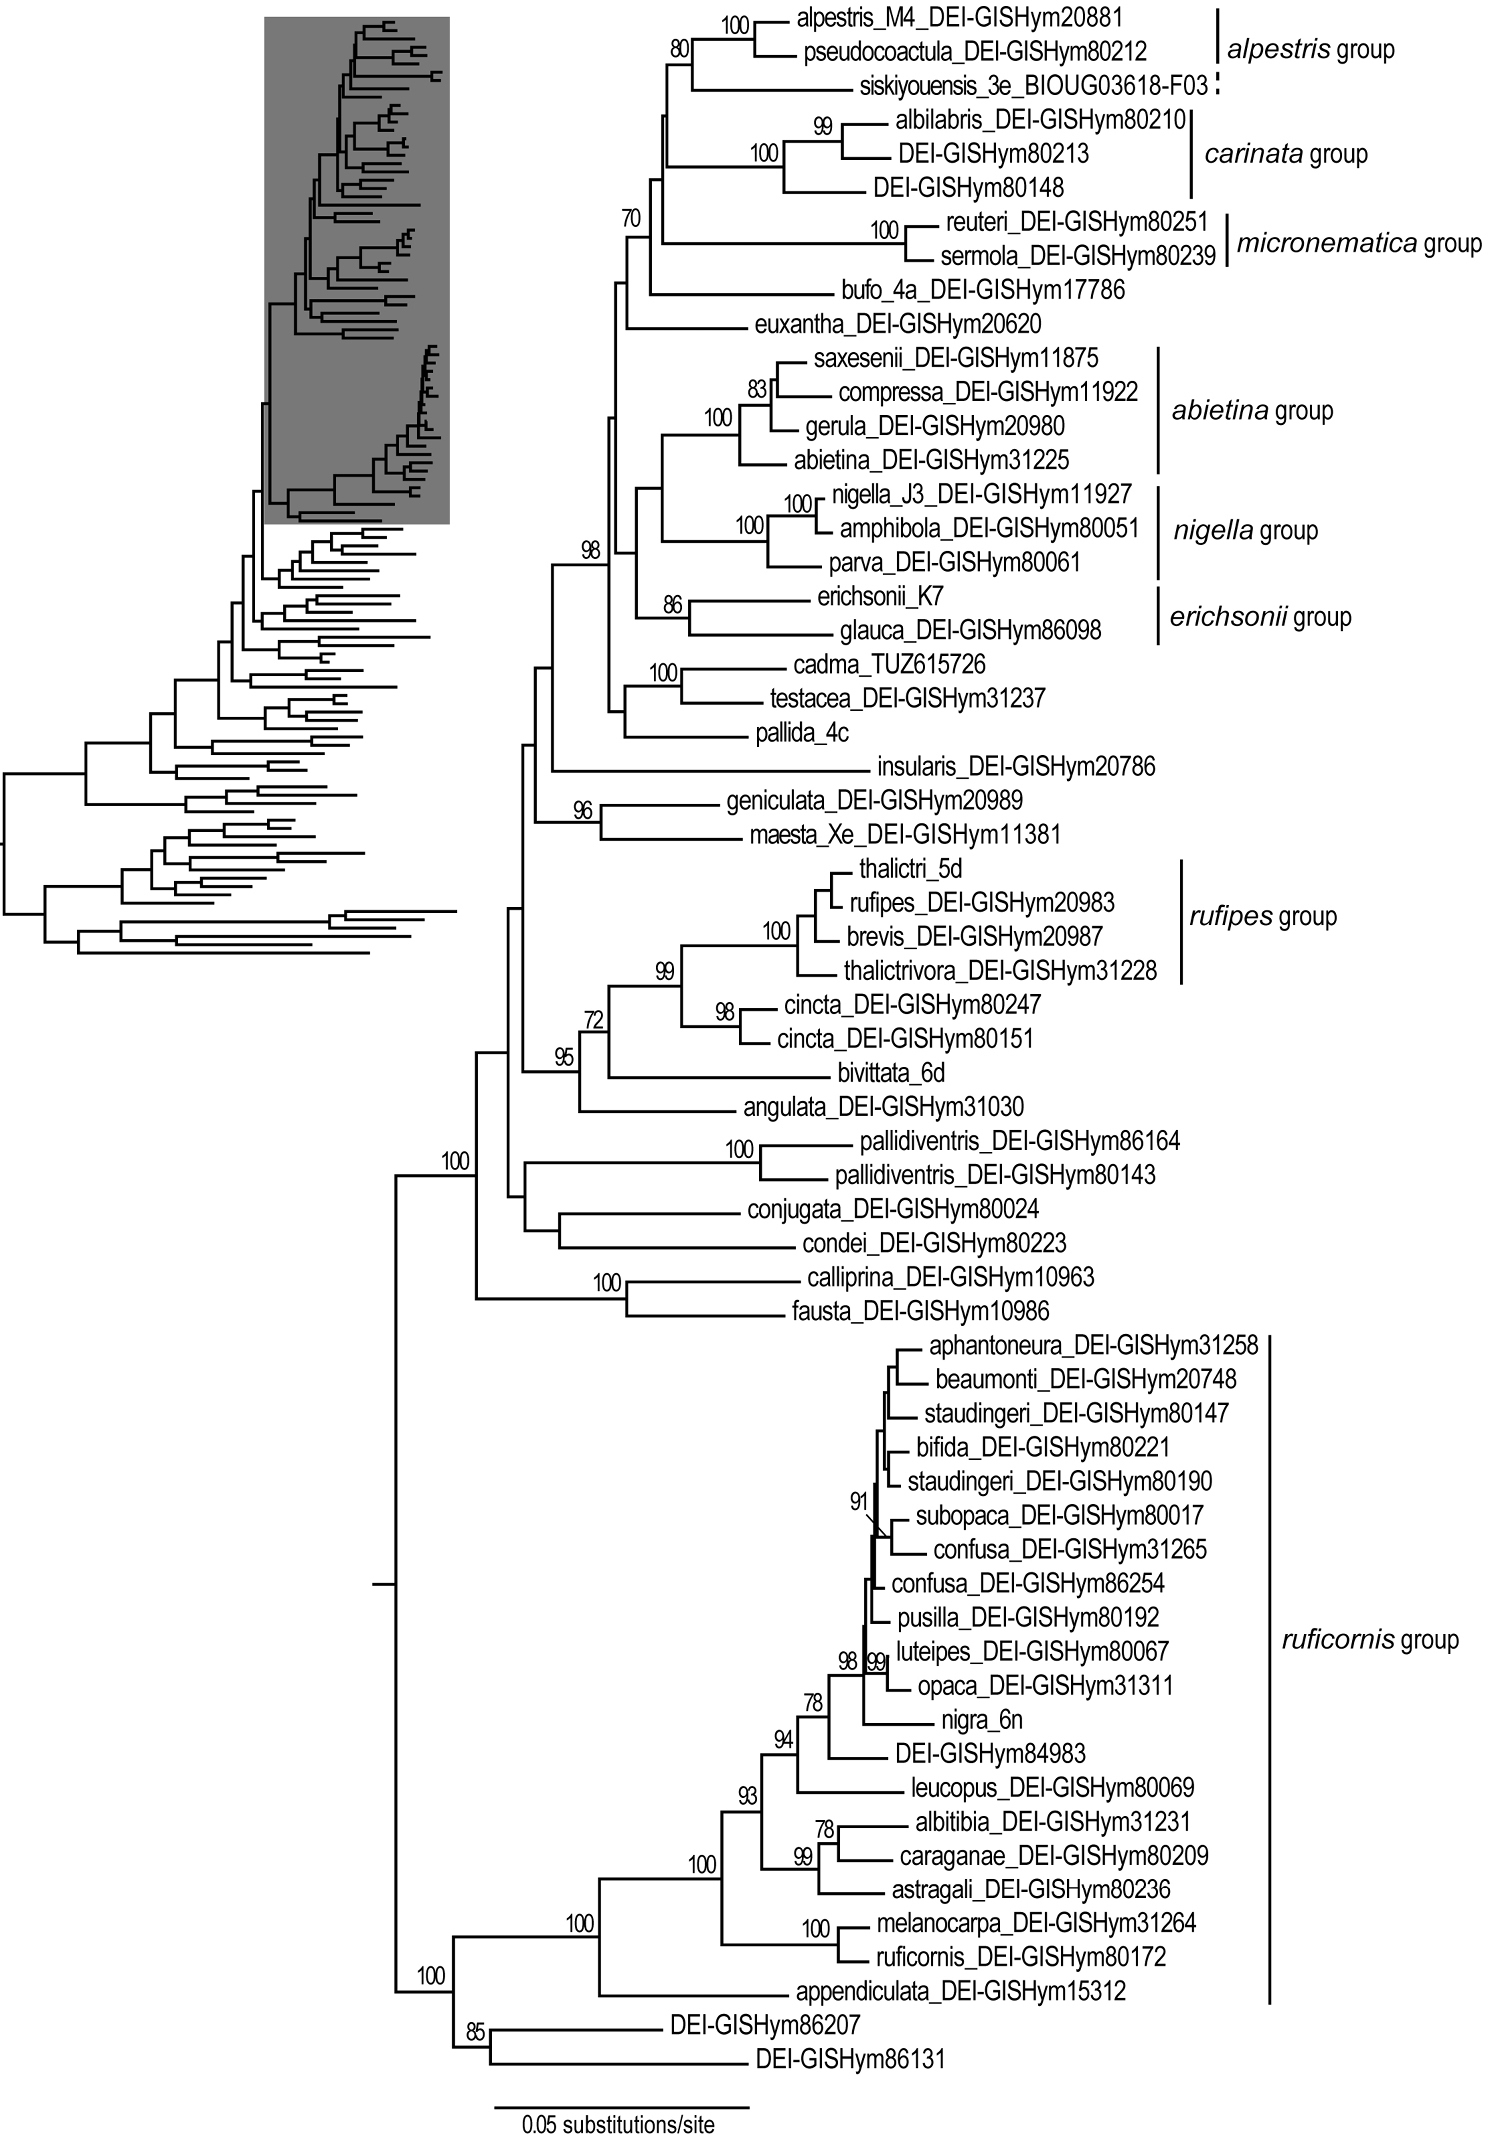
Part of the maximum likelihood tree shown in Fig. 1. Numbers above branches show bootstrap proportions (%). Support values for weakly supported branches (BP<70) are not shown. Outline of the full tree is shown upper left, with the part shown here highlighted. The scale bar shows the number of estimated substitutions per nucleotide position. |