|
||
|
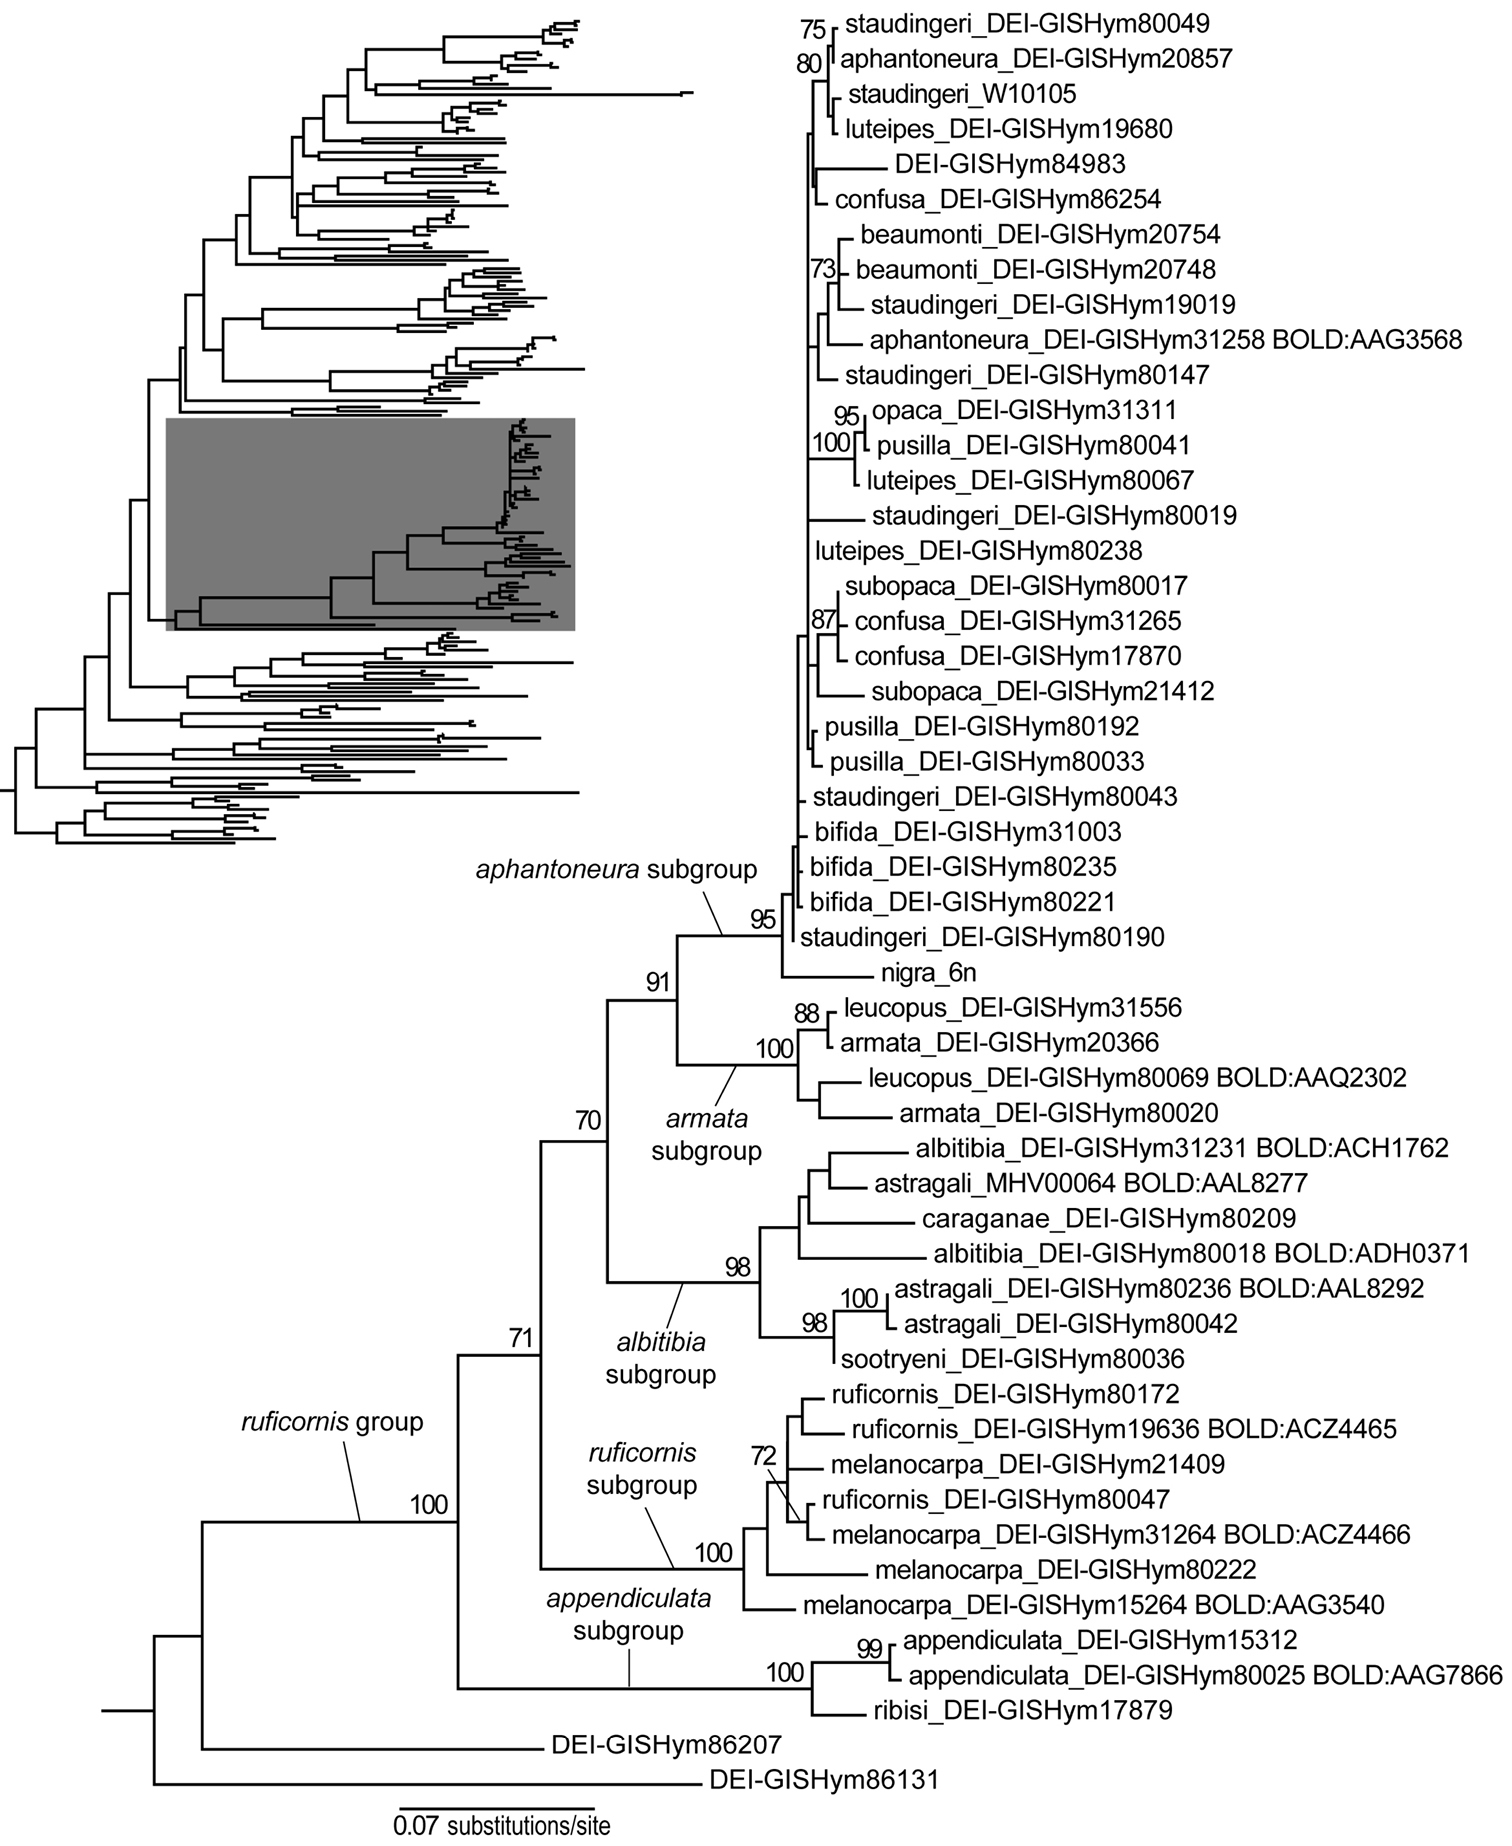
Part of the maximum likelihood tree shown in Fig. 3. Numbers above branches show bootstrap proportions (%). Support values for weakly supported branches (BP<70) are not shown. BIN numbers (BOLD:XXXXXXX) referred to in the text are shown for representative specimens. Outline of the full tree is shown upper left, with the part shown here highlighted. The scale bar shows the number of estimated substitutions per nucleotide position. |