|
||
|
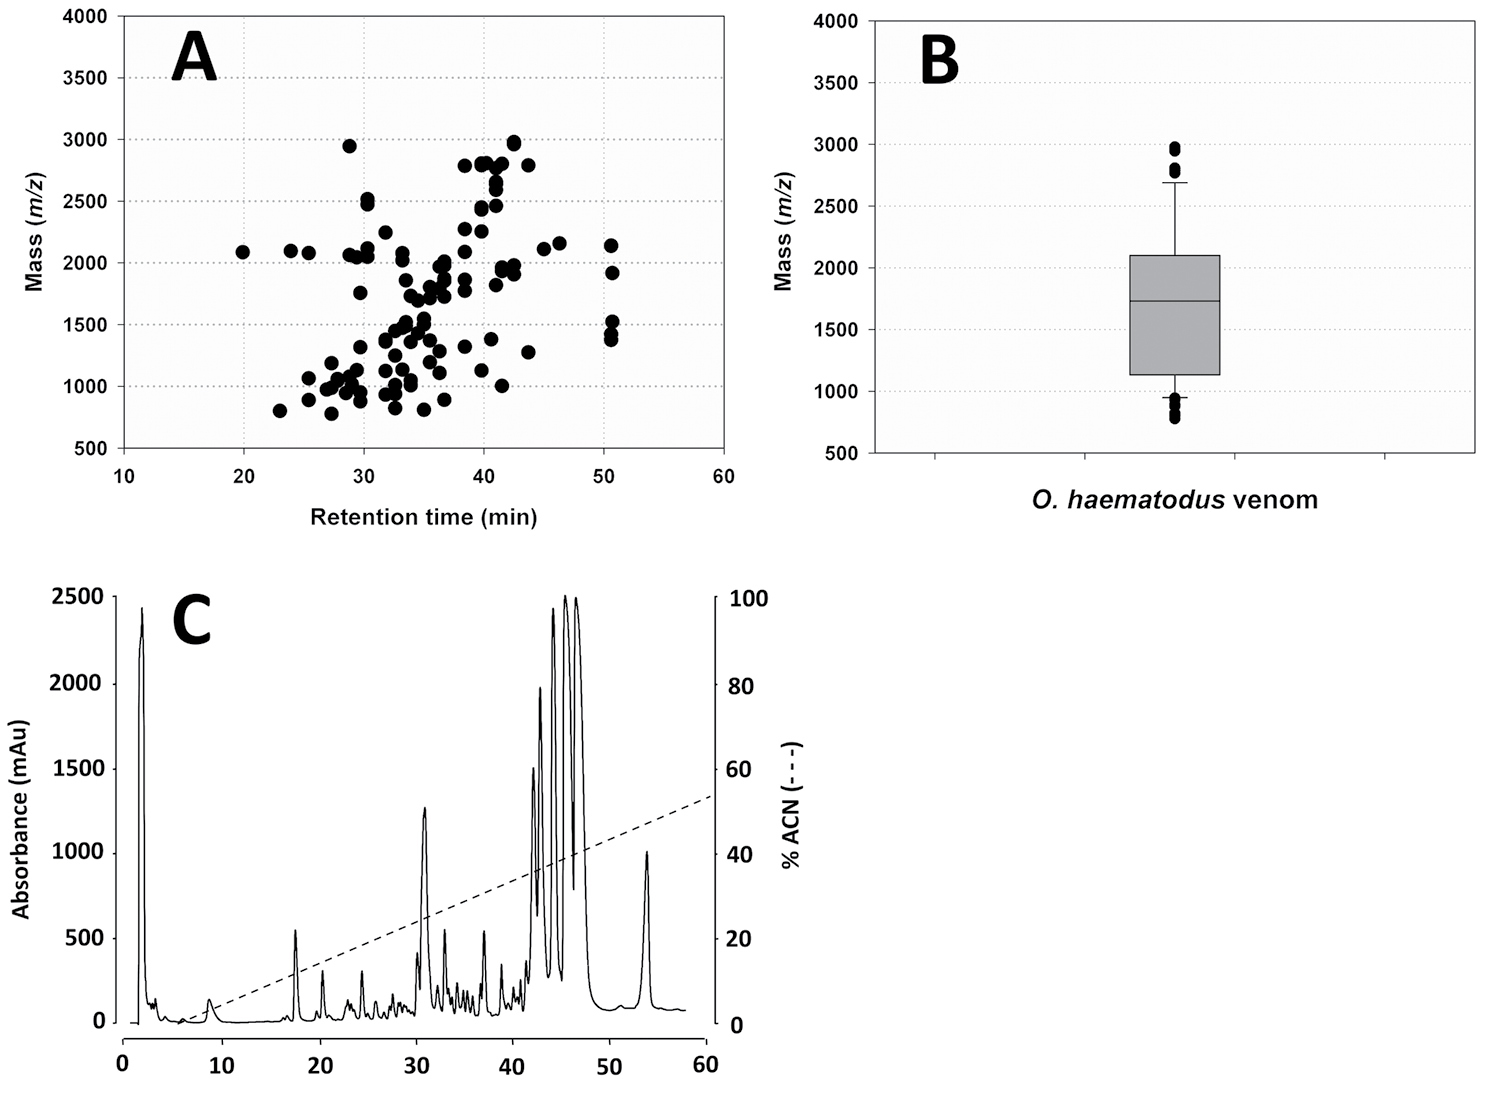
Investigation of the whole Odontomachus haematodus venom peptidome by LC-MS. (A) Two-dimensional landscape of the venom. Dots indicate peptides. (B) Box-and-whisker plot of the peptide mass distribution presented in the 2D venom landscape. The bottom and top ends of the box represent the first and third quartiles, respectively, while the line inside each box represents the median mass. The ends of the whiskers represent the 5-95 percentile range while the dots represent masses outside the 5-95 percentile range. (C) C18 RP-HPLC chromatogram of the venom. The dashed line shows the slope of the ACN gradient. |