|
||
|
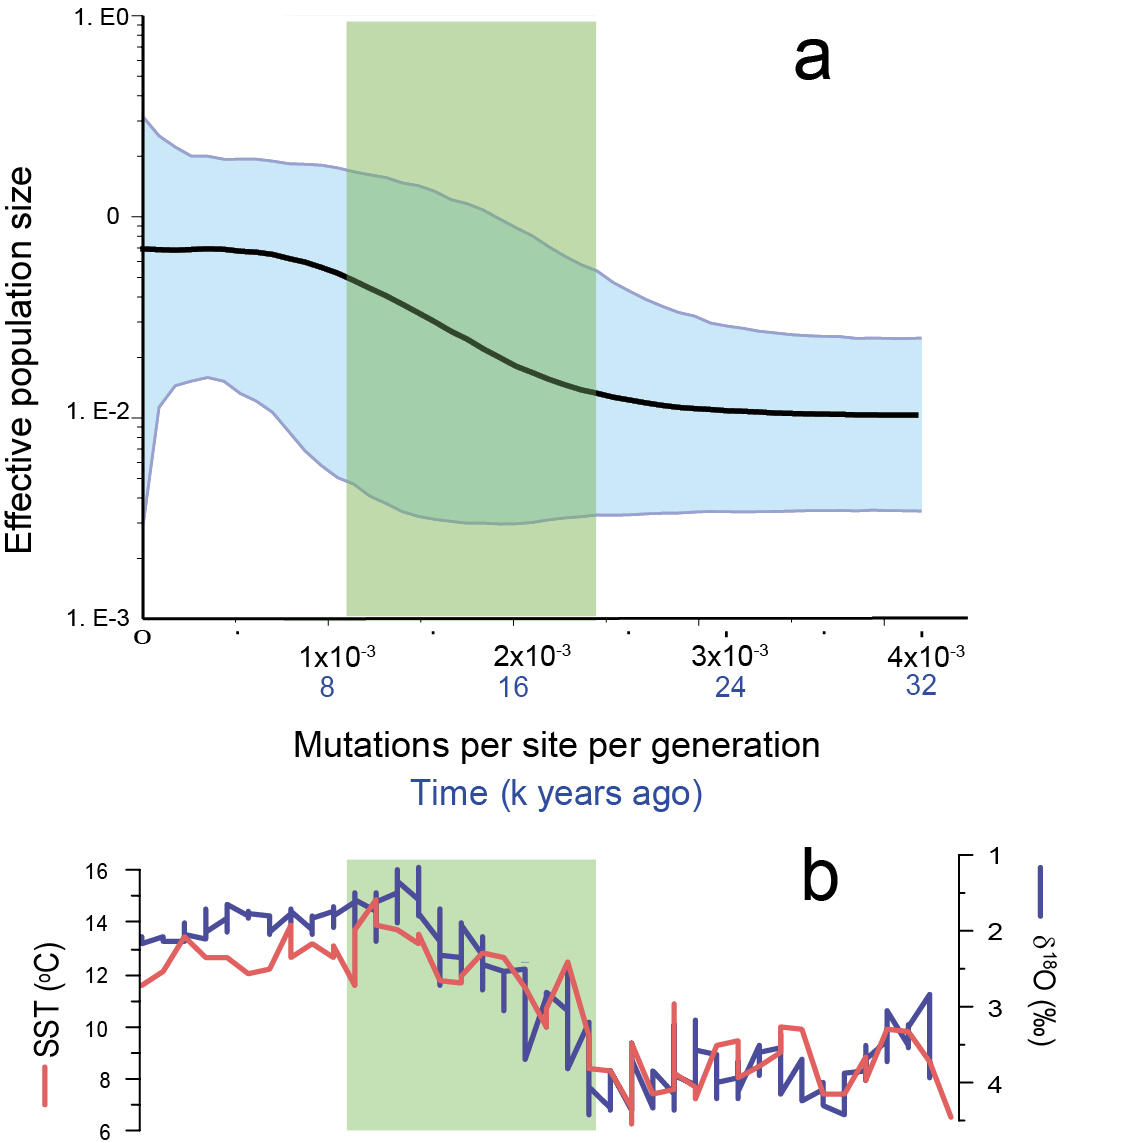
Bayesian skyline plot (a), and (b) graphs of two proxies for historical climate in the southern hemisphere (adapted from Pahnke et al. 2003). These proxies are δ18O ‰ and sea surface temperate (SST) based on Mg/Ca ratios. The boxes indicate the approximate period of elevated haplotype accumulation. |