|
||
|
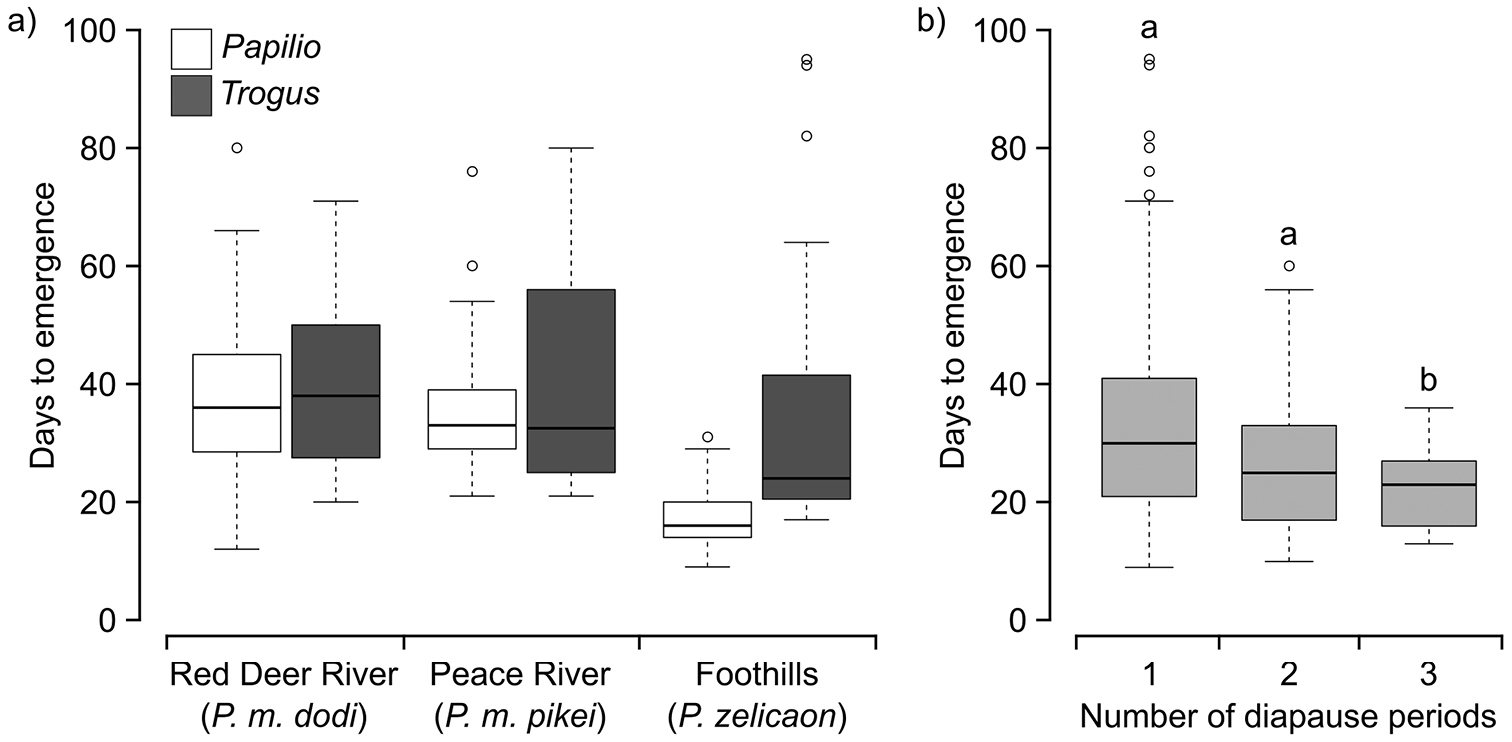
ANOVA results. a Number of days to emergence after simulated diapause for Papilio and Trogus in three geographic regions. There was a significant interaction between number of days to emergence and host/parasite (P < 0.05) b Number of days to emergence after simulated diapause by number of diapause periods for both Papilio and Trogus combined. Different letters above boxplots indicate significant differences (Tukey HSD test, P < 0.05). For both a and b sections of the figure, the median is indicated by the midline and the bottom and top of the box represent the first and third quartiles, respectively. Whiskers indicate the minimum/maximum values or 1.5 times the interquartile range, whichever is smaller, and circles represent outliers. Untransformed data is presented. |