|
||
|
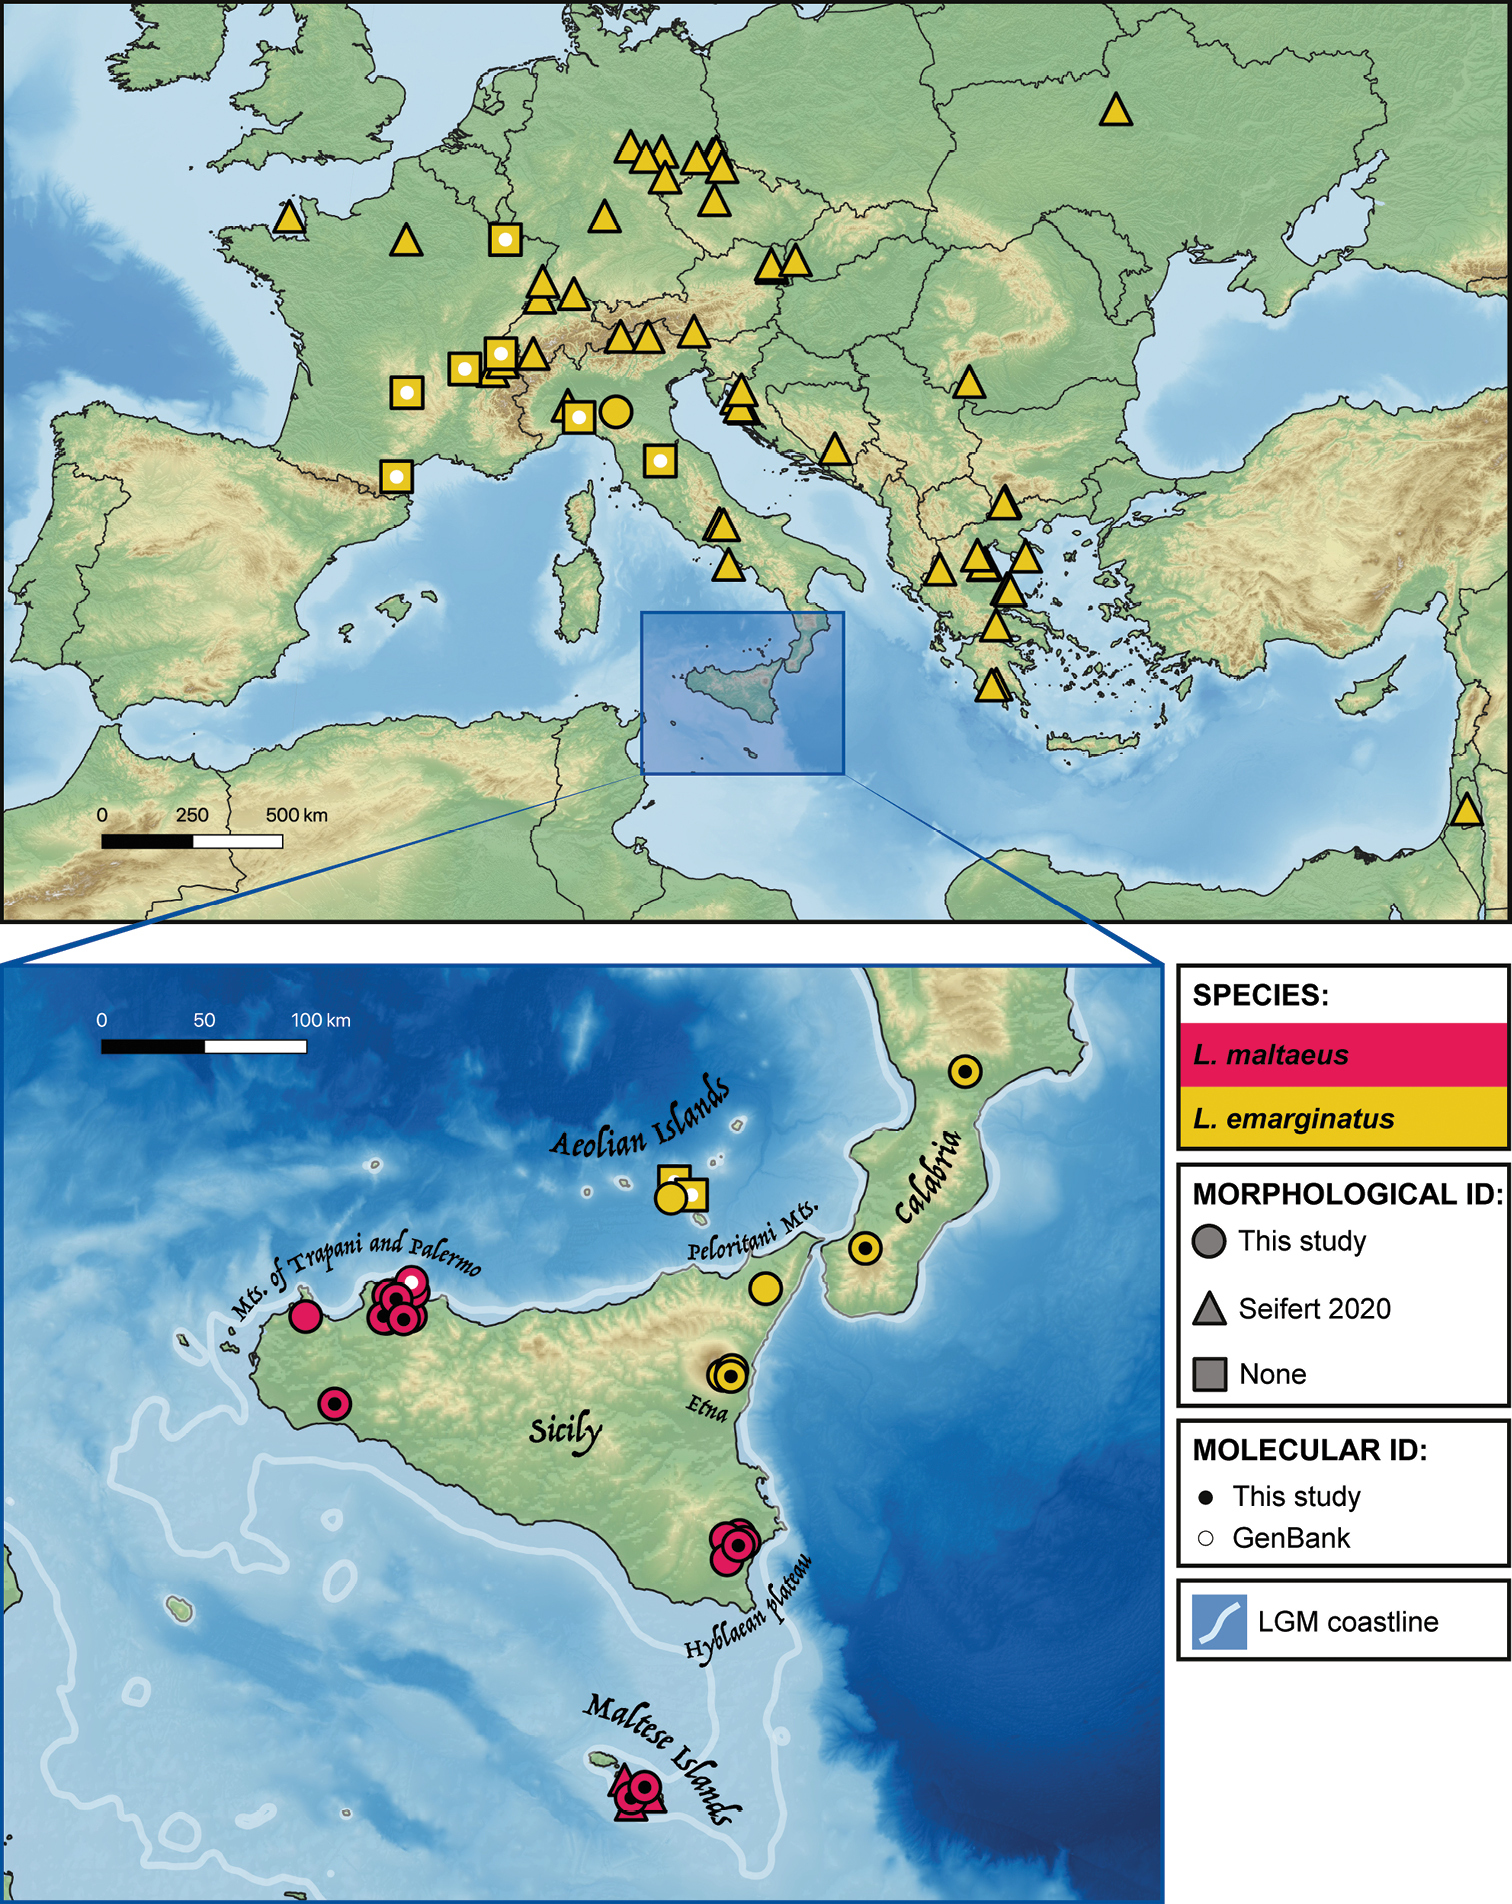
Distribution of the samples of L. maltaeus (red) and L. emarginatus (yellow) investigated in this study with quantitative morphology and/or molecular analysis. The shape of the points represents whether the samples were identified with the linear discriminant (circles: ID in this study; triangles: ID by Seifert 2020; squares: no linear discriminant was used). Inner circles indicate whether molecular data (COI) has been used (black circles: sequences generated in this study; white circles: sequences retrieved from GenBank). Light blues lines in the map below indicate the coastline during the Last Glacial Maximum (LGM). Main toponyms discussed in the text are highlighted in the map. |