


(C) 2013 Jennifer Robin Albert. This is an open access article distributed under the terms of the Creative Commons Attribution License 3.0 (CC-BY), which permits unrestricted use, distribution, and reproduction in any medium, provided the original author and source are credited.
For reference, use of the paginated PDF or printed version of this article is recommended.
Nesting biology and phenology in an aggregation of the primitively eusocial ground-nesting bee Halictus farinosus were studied at Green Canyon, Utah from May to August, 2010. Nest architecture was typical of the genus. Nests were small with an average of 3.5 worker and 13.5 reproductive brood per colony. Most workers were mated (77.5%) and had ovarian development (73.4%). The queen-worker size differential was moderate (8.8% for head width and 6.2% for wing length), indicating that sociality in this species is of intermediate strength compared to other social Halictus species. Results from 2010 were compared with those from 1977/1978 and 2002. Varying weather patterns in the years of study led to changes in phenological milestones: in the colder and wetter spring of 2010, nesting behavior was delayed by up to two weeks compared to the other years. While nest productivity was comparable among years, in 2010 the size difference between queens and workers was significantly larger than in 2002, indicating an effect of annual variation in weather conditions on social parameters in this species.
Sweat bee, phenology, nesting biology, natural history, nest architecture, primitive eusociality, social variability, degree days
The development of eusociality from solitary ancestors is considered one of the major transitions in evolution (
The size of an adult bee depends on the quality (
Halictus farinosus Smith is found in western North America ranging from British Columbia, south to California and east to Nebraska (
Halictus farinosus has a two-phase life cycle and exhibits colony social organization similar to other primitively eusocial halictines (reviewed by
In this study we present phenological, sociobiological and nest architecture data from field studies on Halictus farinosus in North Logan, Utah. As this population has been studied previously (
Nests were excavated in July and August 2010 at Green Canyon, North Logan, Utah (41°46.15N, 111°46.39W, elevation 1590 m) where Halictus farinosus had been previously studied (
Nests referred to as first brood nests are those excavated on or before 17 July which was the date when the first workers emerged. Second brood nests were any nests excavated after 17 July. Most second brood nests, referred to as late summer nests, were excavated during a short period in the week following 7 August, just before the second brood began to emerge (see Table S1 for excavation dates). This was done to maximize the amount of the second brood that was present during excavation.
Nest entrances were blocked before dawn on the morning of excavation to ensure that all nest members would be captured during excavation. Nest excavation methods were as described by
Adult females were dissected and measured using a Leica WILD M3B light microscope equipped with an ocular micrometer at 16 x magnification following the general methods of
Size differences between castes were calculated following
where SQ and SW are the sizes (head width or wing length in mm) of the queen and worker respectively.
Weather data were gathered from the Utah State University climate centre website (2011) from a weather station 5.5 km away from the study site for all years this population had been studied (1976, 1977, 2002, 2010). The 65 year average temperature, used to cover all years of study and the 30 years before the initial year of study, was also obtained from this website. Degree days (base 10) were calculated for each day by the basic equation:
Where Tmin and Tmax are the minimum and maximum temperatures reached that day. These data were used to calculate cumulative degree days (
Foundress productivity was measured as the average number of offspring (including all eggs, larvae, pupae and callow adults) in first brood nests after the foundress had stopped foraging. Productivity in second brood nests was calculated as brood per working female. Because worker mortality was high, minimum productivity was also calculated as the number of second brood offspring present divided by the average number of first brood individuals found in nests multiplied by the proportion of first brood that was female. The sex ratio presented is the number of males divided by all brood.
A paired T-test was used to compare the size of the queen with that of her largest worker. Because most parameters measured were not normally distributed, all other tests of significance were Wilcoxon Mann-Whitney rank sum tests performed in R (version 2.15.2,
All colonies studied were singly founded and foraging had commenced in some colonies by the initiation of the study on 13 June 2010. Only one Halictus farinosus female was witnessed to initiate excavation of her nest after this point. The last foraging trip taken by a foundress was observed on 12 July (Table 1). From early July, foundresses were frequently seen guarding nest entrances and rarely left the nest. Nest excavations began on 28 June, the first fully developed adult worker found in a cell was excavated on 15 July and the first adult first brood individual, a female, was observed leaving a nest on 17 July (Table 1). No new nests were founded after first brood emergence in the area of observation. Although detailed data were not collected, daily observations at the nest site indicated that worker foraging slowed noticeably after the first week of August. The first fully developed, second brood male was found on 11 August and the first adult female in the second brood was excavated on 12 August. Figure 1 shows nest contents by developmental stage over 6 day periods throughout the season.
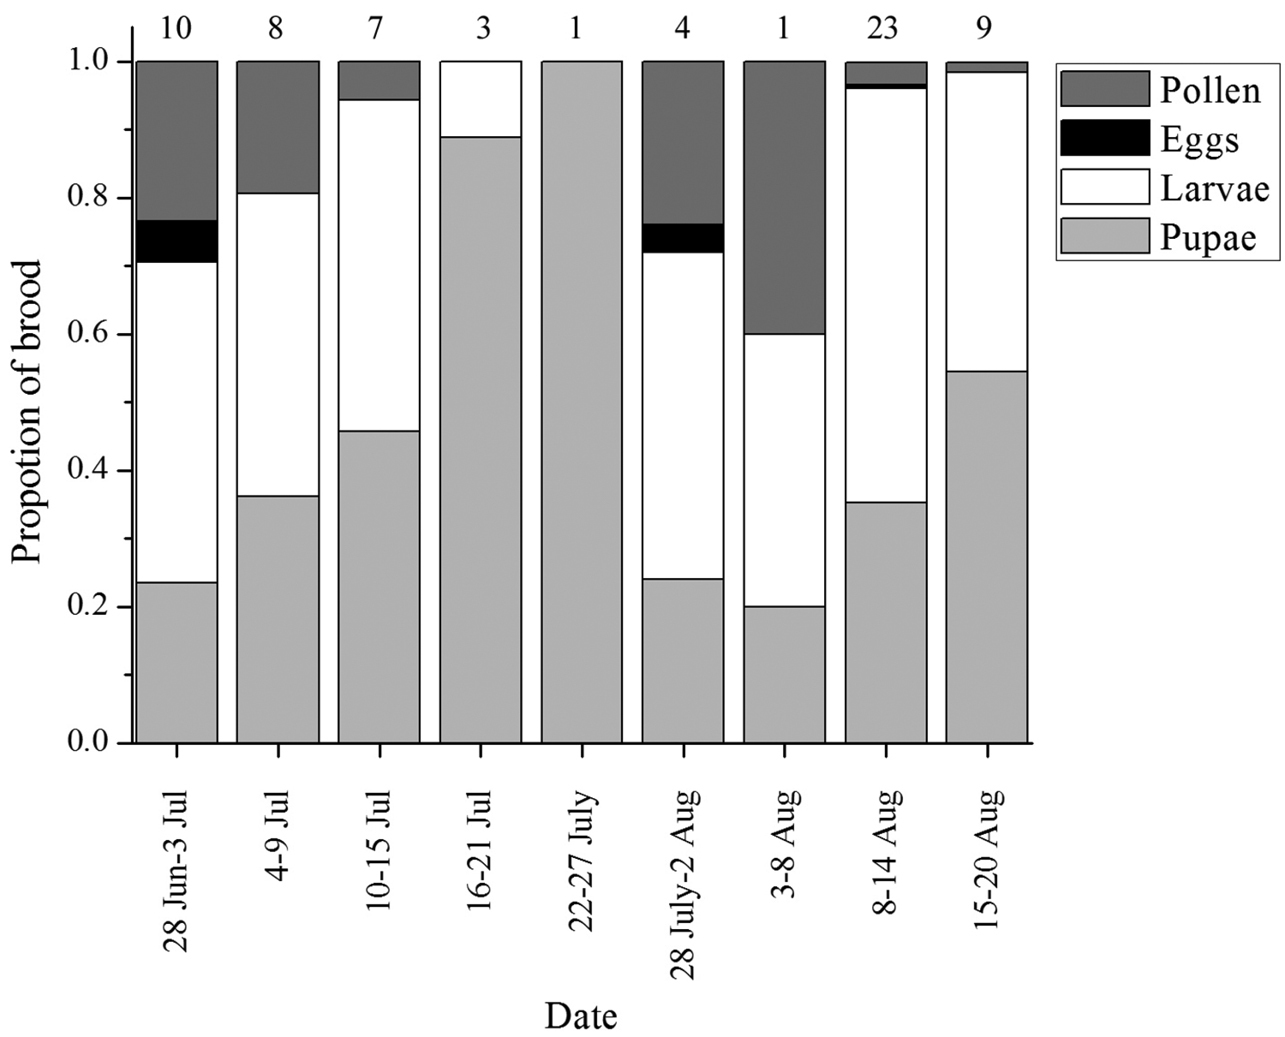
Percentage of brood in different developmental stages throughout the season, taken every six days. The rate of nest excavation throughout the season was not consistent. Numbers above each column represents the number of nests excavated during that time period.
Summary of phenological data for all Halictus farinosus studies in Green Canyon. N/A indicates that the information in the column was not given in the study. In
| 1976 | 1977 | 2002 | 2010 | |
|---|---|---|---|---|
| Queen foraging slows | N/A | N/A | 28 June | 12 July |
| First adult worker | “Late June” | 8 July | 2 July | 15 July |
| First reproductive brood cells | N/A | N/A | 3 July | 17 July |
| First reproductive adult male | “Late July” | “Early August” | 30 July | 11 August |
| First reproductive adult female | “Early August” | “Mid August” | 30 July | 12 August |
| Source | Nye, 1980 | Nye, 1980 | Sellars, 2004 | Present study |
Surveys of all study plots conducted in mid-June and repeated in early August indicated a nest mortality rate between these times of 59.5%. Colonies that were particularly inactive may have been missed in either survey.
Halictus farinosus nests in Green Canyon were easily identified by their large tumuli (see
Nest depth for first brood nests ranged from 11 to 41 cm (x = 20.4 cm, SD = 7.3, N = 29), and shallowest and deepest brood cells were 7 cm and 20 cm respectively (x = 14.4 cm, SD = 2.8, N = 29). Second brood nests ranged from 12 cm to 44.5 cm in depth (x = 30.3 cm, SD = 6.1, N = 37) and as a result were significantly deeper (W = 153, p < 0.001) than first brood nests. Second brood nests had cells reaching to or very near to the end of the burrow.
The average number of cells in first brood nests was 4.4 (SD = 2.0, N = 29) including brood cells, empty cells and those containing only pollen. There were significantly more cells in second brood nests with an average of 20.1 in nests excavated late in summer (after 7 August) (SD = 10.1, N = 32, W = 79, p < 0.0001) which were expected to approach maximum brood sizes. This included empty cells that were previously occupied by first or second brood individuals and cells with mouldy contents. The percentage of cells containing mouldy contents (mostly pollen) over all nests was 6.7%.
In both broods, individuals at later developmental stages tended to be relatively closer to the nest entrance and cells containing only fresh pollen were always among the deepest excavated indicating that shallower cells were completed first.
Sixty-six nests were excavated, 29 containing juvenile first brood and 37 containing mostly the second, reproductive brood. The first brood nests contained between 0 and 7 first brood individuals with an average of 3.5 (SD = 2.0, N = 29). There were fewer brood than brood cells because in some cases cells were unfinished or contained mouldy pollen.
At the time of excavation an average of only 1.7 adult workers (range 0 – 7) were present within second brood nests. Active second brood nests produced between 1 and 46 brood with an average of 13.5 per nest (SD = 9.9, N = 37).
A breakdown of all nest contents in the first and second brood nests is presented in Table S1. The nest foundress was present in 22 of 29 first brood nests and 13 of 32 second brood nests (Figure 2). It could not be determined if the foundress was present in the remaining five second brood nests because adults in those nests had not been marked and genotype data were not available. Mean productivity of the foundress alone (first brood nests) was between 0 and 7 with an average of 3.5 brood, comprising 3.0 females and 0.5 males per nest. The sex ratio in the first brood was 0.149 weighting nests equally and 0.159 with individuals weighted equally. Mean productivity of first brood females was calculated using an estimate of the number of first brood females over the lifetime of the colony. As the mean number of second brood individuals produced per nest was 13.5 this gives 4.5 reproductive brood per worker female. Mean maximum second brood productivity per worker using the actual number of workers found in the nest was 7.0. The sex ratio in the second brood was not significantly different from 1:1 at 0.464 averaged over nests and 0.445 in the population as a whole.
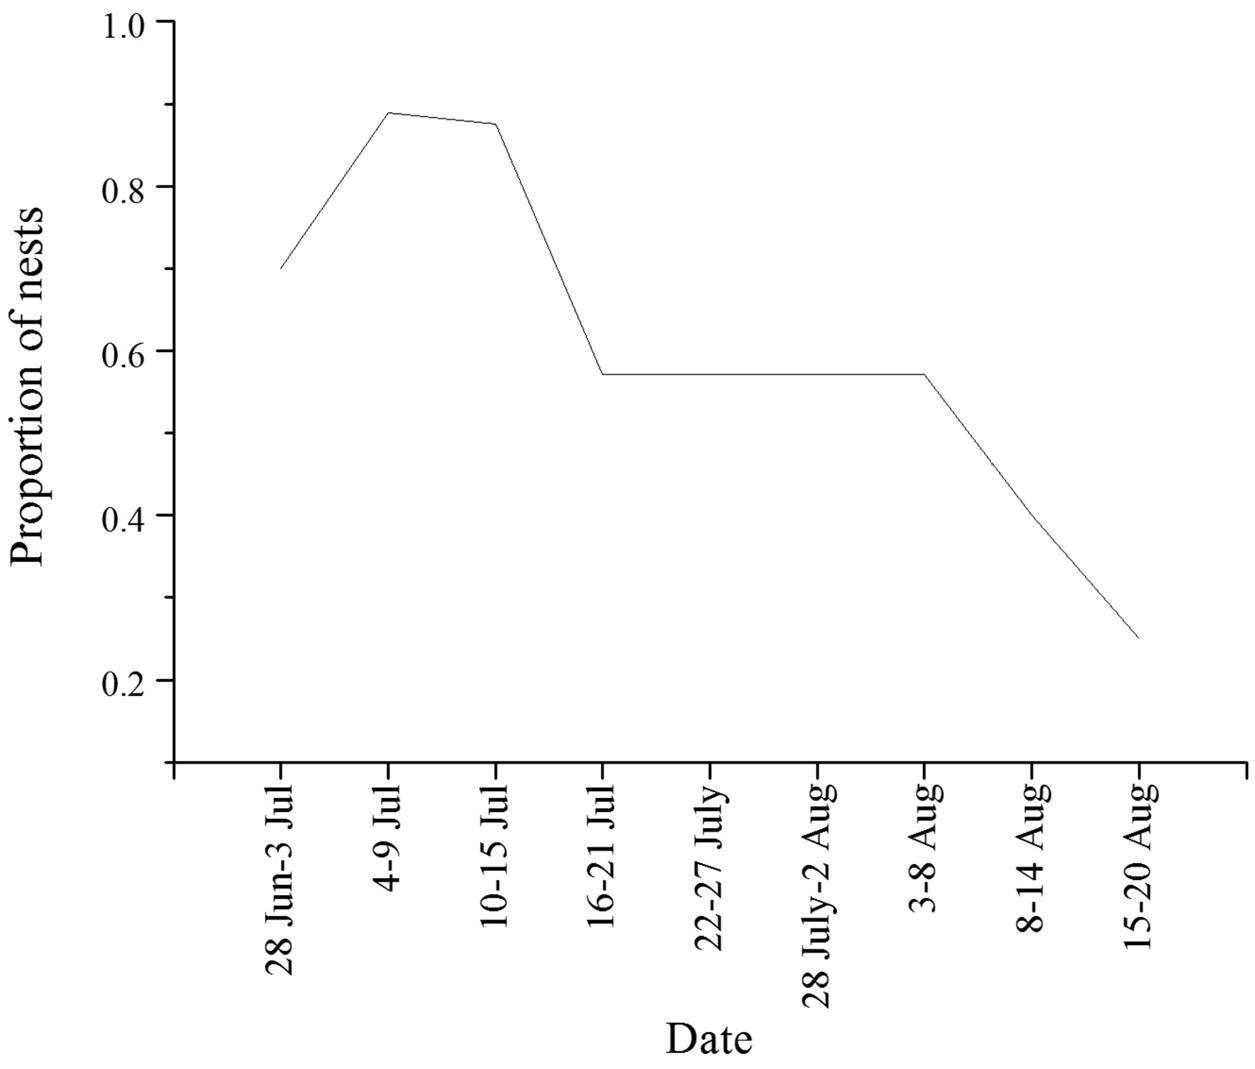
Proportion of nests excavated with the queen present, organized in 6 day intervals. Very few excavations took place between 16 July and 8 August so data are pooled together to show overall trend during this period. See Figure 1 for the number of nests excavated during each period.
Dissections of 49 workers revealed that 36 (73.5%) had some level of ovarian development and 31 of 40 (77.5%) were mated (the spermatheca was not found in 9 of the workers dissected) (Table 2). All queens dissected were mated (N = 31) and all but one that was found dead in the nest with desiccated ovaries had some level of ovarian development (N = 31). The level of ovarian development in queens (x = 1.185, SD = 0.668, N = 31, Table 2) was significantly greater than in workers (x = 0.648, SD = 0.673, N = 49, W = 884.5, p = 0.001, Table 2). Workers in nests where the queen was present had lower but not significantly less ovarian development than workers in orphaned colonies (Table 3).
Queens averaged significantly larger than workers in both head width and wing length (Table 2). This gives a population-wide caste size difference of 6.25% for head width and 6.37% for wing length. Queens were also generally larger in both measures than their own workers with a mean percent difference of 8.79% for head width and 6.19% for wing length. Queens were found to be significantly larger than their largest worker in a paired T-Test for both head width (t = 3.34, p = 0.007) and wing length (t = 2.77, p = 0.018).
Comparisons of ovarian development, matedness, head width, wing length, mandible and wing wear between queens and workers throughout the 2010 season. Means are presented with their standard deviations.
| Queen | Worker | Statistical comparison | |
|---|---|---|---|
| Amount of ovarian development | 1.185 +/- 0.668, 31 | 0.648 +/- 0.673, 49 | W = 884.5, p = 0.001 |
| Percentage with developed ovaries | 96.8, N = 31 | 73.5, N = 49 | |
| Percentage mated | 100, N = 31 | 77.5, N = 40 | |
| Head width (mm) | 3.52 +/- 0.15, N = 33 | 3.30 +/- 0.15, N = 55 | W = 1528, p < 0.0001 |
| Wing length (mm) | 3.14 +/- 0.15, N = 27 | 2.94 +/- 0.13, N = 45 | W = 1017, p < 0.0001 |
| Mandible wear | 3.75 +/- 1.21, N = 28 | 3.57 +/- 1.53, N = 45 | W = 749, p = 0.61 |
| Wing wear | 3.13 +/- 1.36, N = 30 | 2.81 +/- 1.64, N = 43 | W = 655, p = 0.232 |
Queens were not generally more worn than workers in either mandible or wing wear (Table 2). Both wing and mandible wear increased throughout the season in queens, and more steeply in workers (Figure 3).
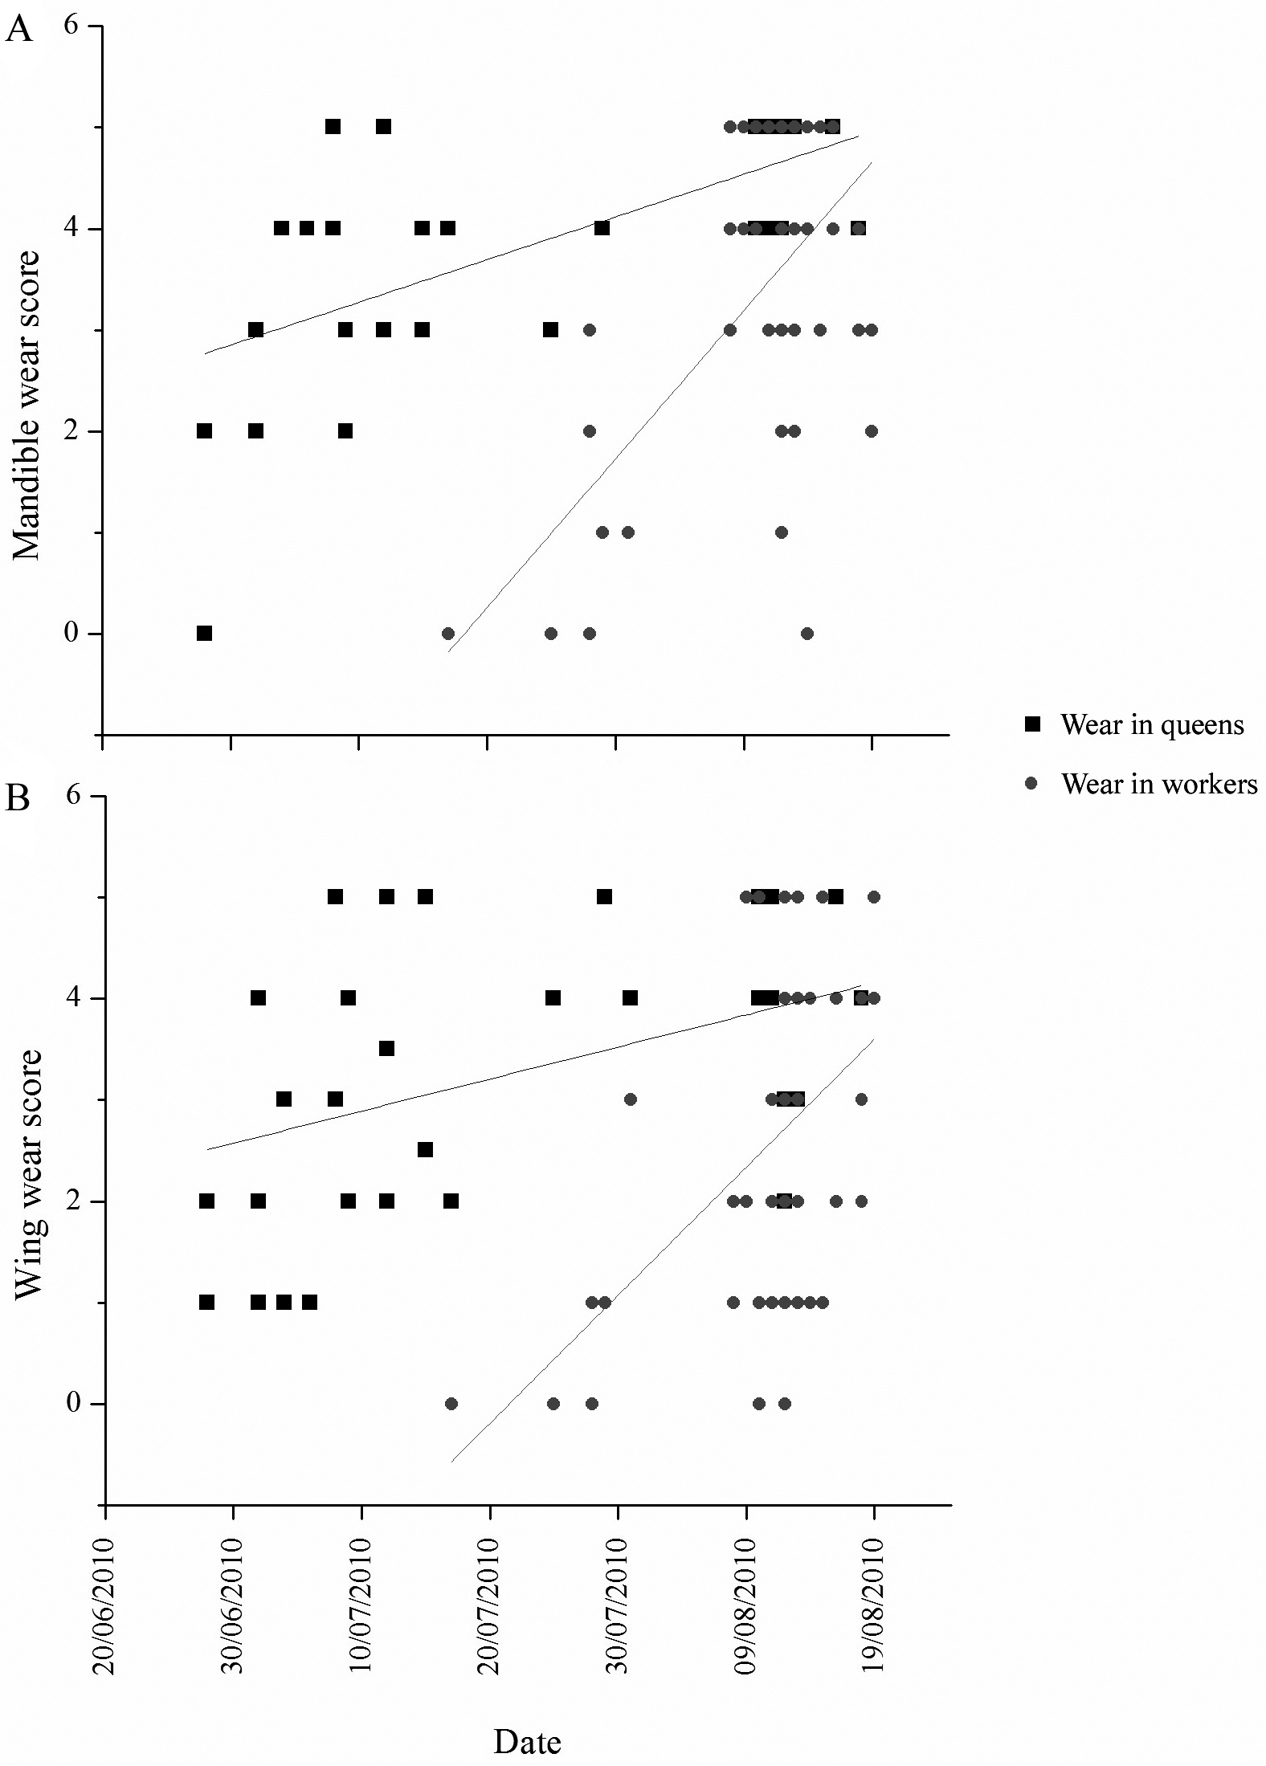
Wear of mandibles (a) and wings (b) of queens (black squares) and workers (grey circles) over time.
Minimum and maximum temperatures were low in the spring of 2010 compared to the 65 year average but were comparable to the average throughout the summer (Figure 4). Spring rainfall was high in 2010 compared to average, but was close to average throughout the rest of the season (Figure 5). Degree days accumulated slowly in 2010 compared to the other years of study (Figure 6) due to colder maximum and minimum temperatures in the spring (Figure 4). Degree days in 1976 and 1977 accumulated more quickly than in the more recent years of study (Figure 6) due to high minimum temperatures in these years (Figure 4).
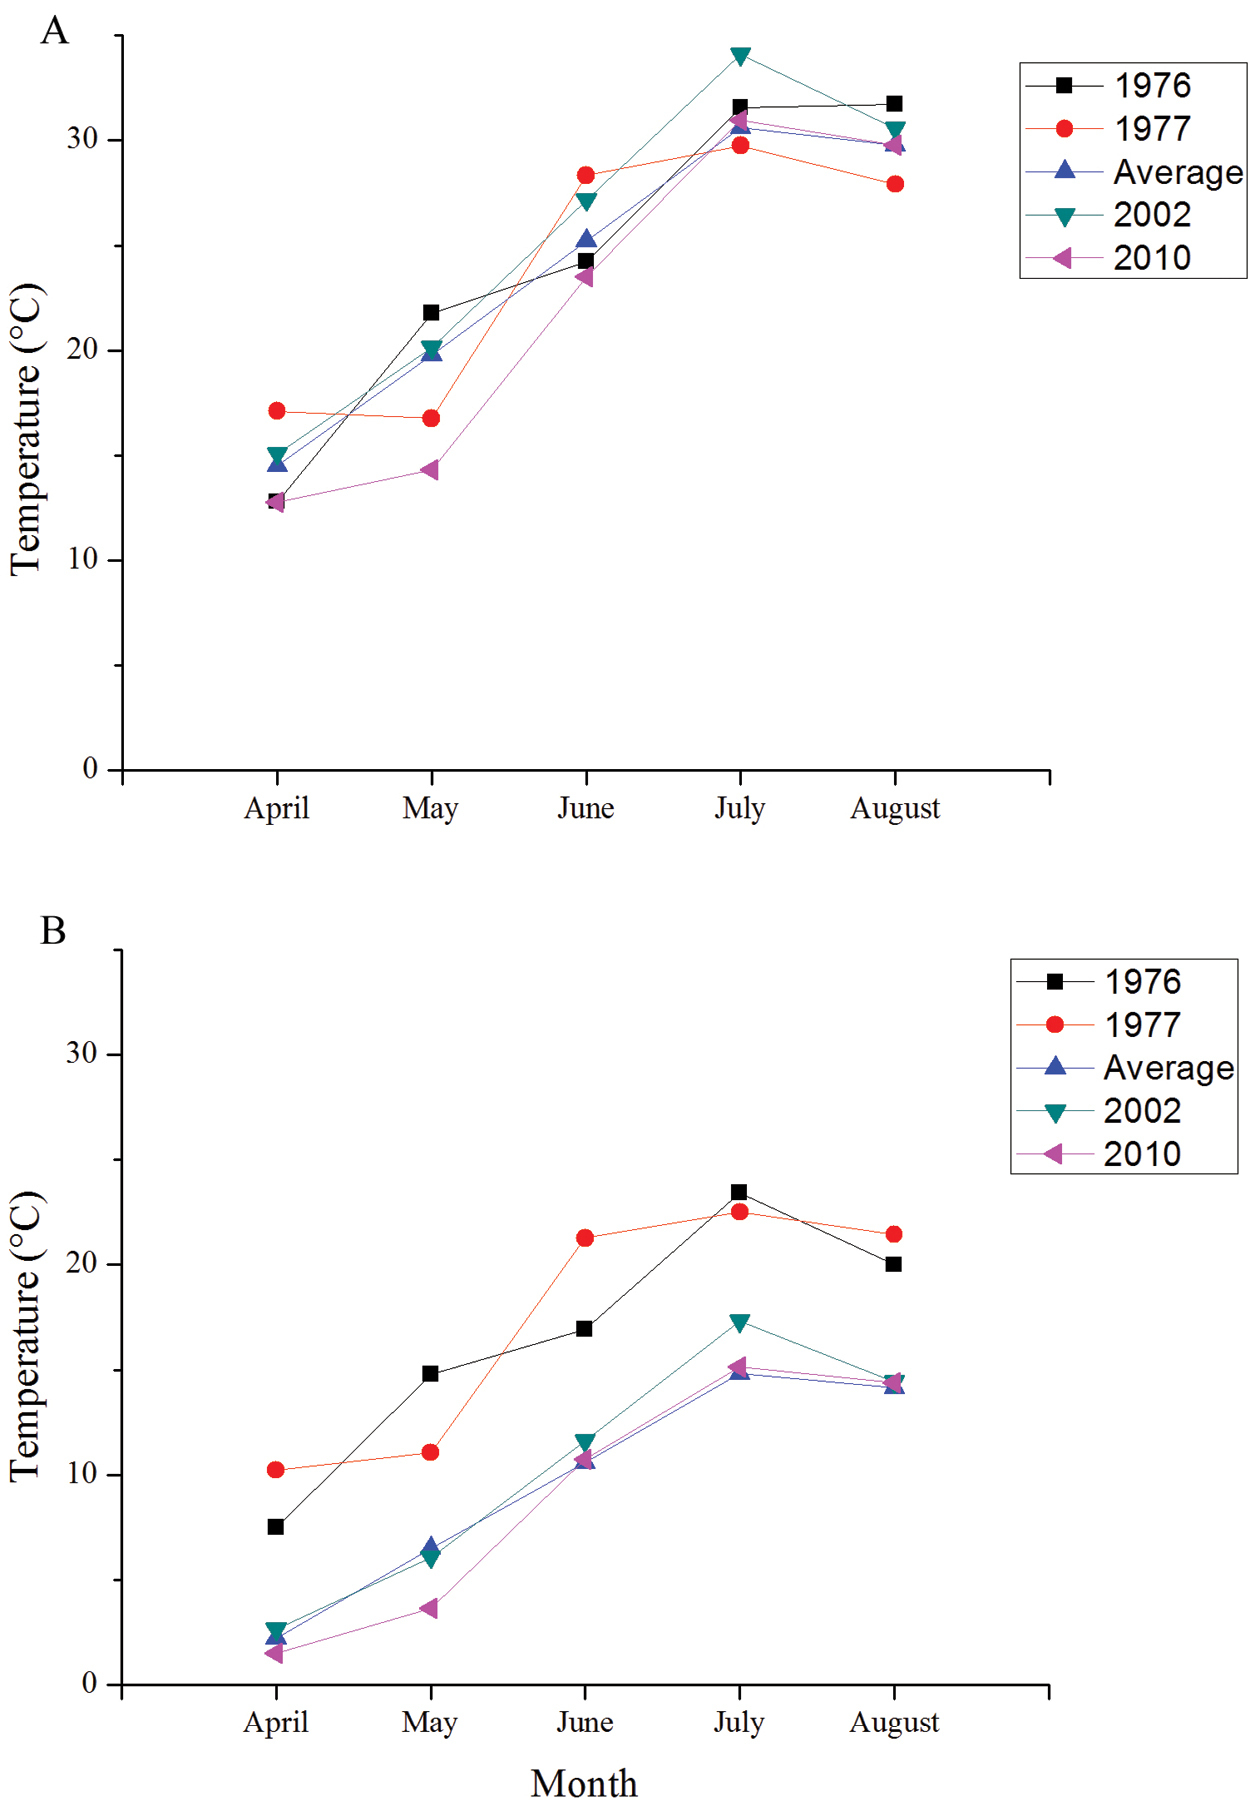
Average daily maximum (a) and minimum (b) temperatures for the four years of study on Halictus farinosus in Green Canyon and the seasonal average over the previous 65 years.
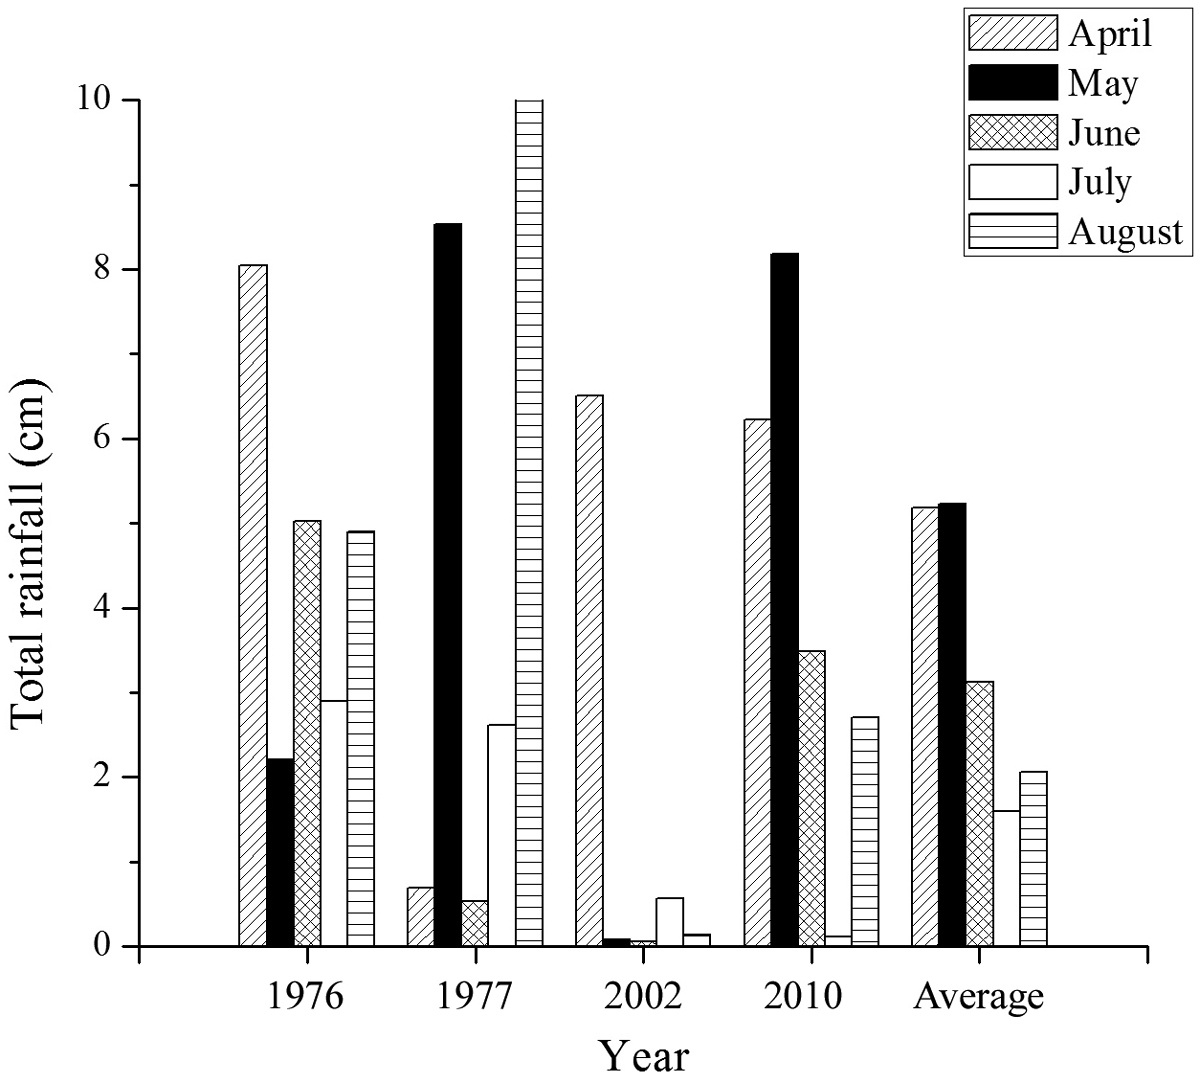
Total rainfall per month for the four years of study on Halictus farinosus in Green Canyon and the monthly average over the previous 65 years.
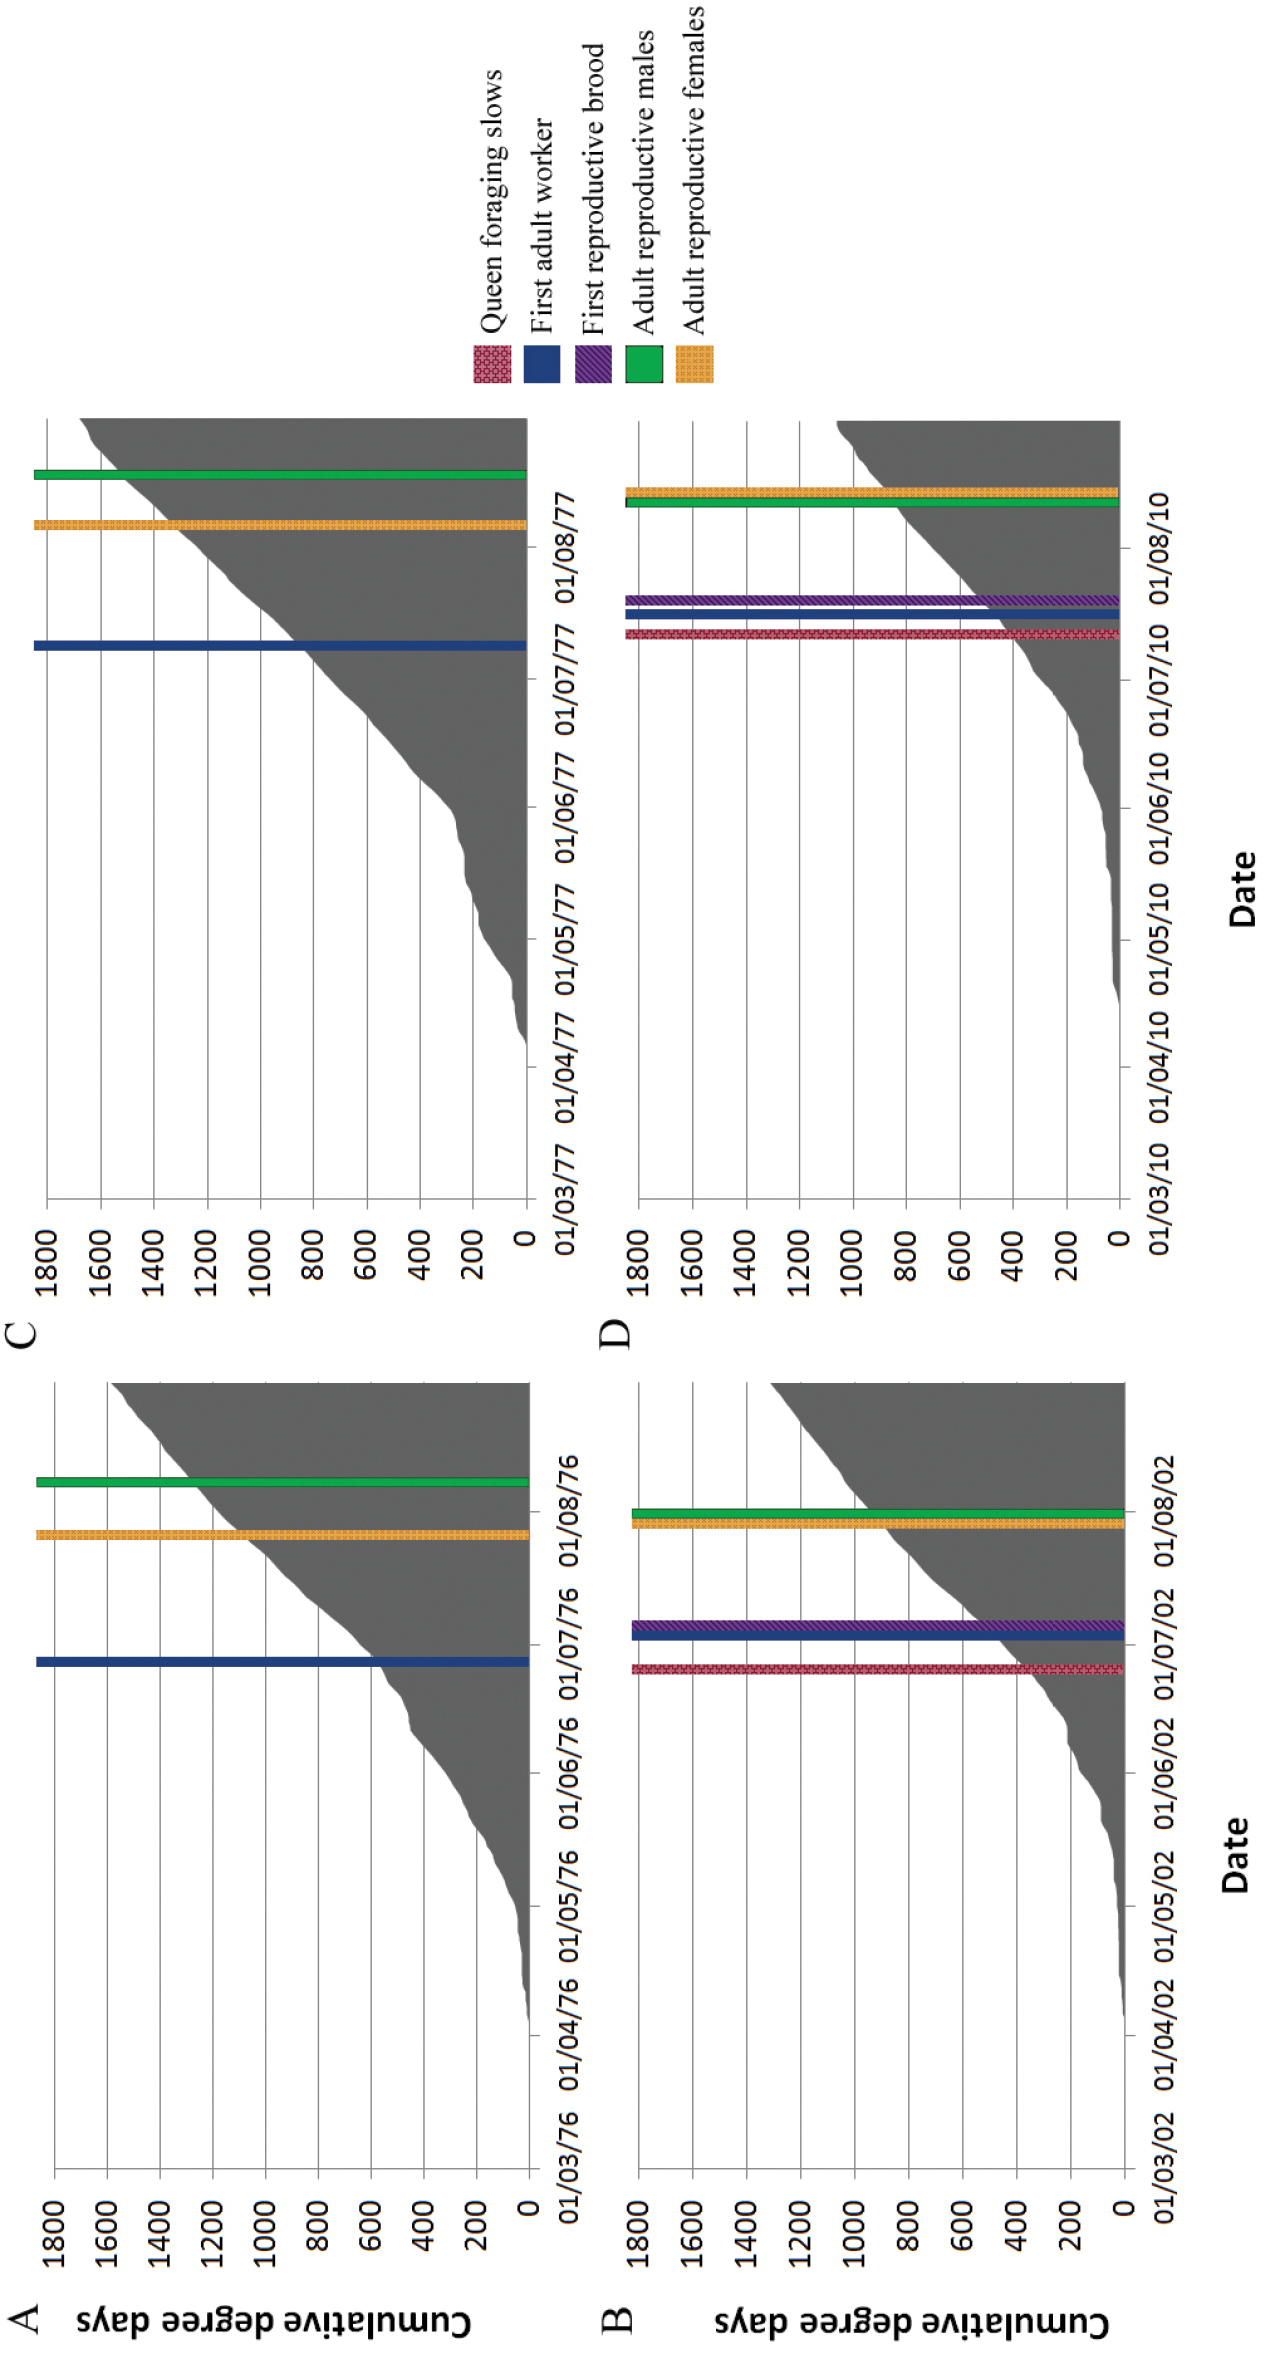
Cumulative degree days between March and August in 1977, 1978, 2002 and 2010. Phenological markers (queen foraging slows, first adult worker, first reproductive brood cell, first adult male reproductive, first adult female reproductive) have been included as coloured bars to note the dates of the events. Males and females from the second brood were not differentiated in the 2002 study, and some events were not recorded in 1977 and 1978.
Nests were shallower in both brood producing periods in 2010 (Brood 1: x = 22.1, SD = 7.4, N = 21, W = 434, p = 0.022, Brood 2: x = 30.3, SD = 6.1, N = 37, W = 2694, p < 0.0001) compared to 2002 (Sellars, 2004; Brood 1: x = 26.7, SD = 6.8, N = 30, Brood 2: x = 42.7, SD = 10.6, N = 86, Table 3). However, the number of brood produced per nest in both worker and reproductive phases was comparable. The number of first brood individuals produced in 2010 (x = 3.52, SD = 1.96, N = 29) and 2002 (x = 3.20 SD = 2.64, N = 30) did not differ significantly (W = 488, p = 0.420, Table 3). Second brood productivity also did not differ significantly (2010: x = 13.49, SD = 9.93, N = 37, 2002: x = 13.06, SD = 13.36, N = 81, W = 1727.5, p = 0.184) (Table 3). Brood per working female (as estimated based on workers present) did differ significantly between years with a greater amount of productivity per female occurring in 2010 (2010, x = 6.99, SD = 4.21, N = 35) (2002, x = 6.09, SD = 7.11, N = 70) (W = 914, p = 0.021). The percent difference in head width between queens and workers was significantly greater in 2010 than in 2002 (8.79% cf 5.79%; W = 424, p = 0.027). The proportion of workers that were mated also differed greatly between years with 77.5% of workers mated in 2010 and only 46.1% mated in 2002 (Table 4). A greater percentage of workers in 2010 had developed ovaries but the average level of egg development in workers was not significantly different between years (W = 2114.5, p = 0.607, Table 4).
Comparison of Halictus farinosus nest size, number of cells and mean offspring number in 2002 and 2010.
| 2002 | 2010 | Statistical comparison | ||
|---|---|---|---|---|
| First Brood | Depth (cm) | 26.7 +/- 6.8 | 22.1 +/- 7.4 | W = 434, p = 0.022 |
| Cells per nest | 1 – 12 | 1 – 9 | ||
| Mean offspring +/- SD | 3.2 +/- 2.64 | 3.5 +/- 2.0 | W = 488, p = 0.420 | |
| Second Brood | Depth (cm) | 42.7 +/- 10.6 | 30.3 +/- 6.1 | W = 2694, p < 0.0001 |
| Cells per nest | 3 – 56 | 3 – 45 | ||
| Mean offspring +/- SD | 13.1 +/- 13.4 | 13.5 +/- 9.9 | W = 1727.5, p = 0.184 |
Summary of egg development and matedness in queens and workers in 2002 and 2010. Averages are presented with standard deviations. Females are grouped based on their development score (ds).
| 2002 | 2010 | |||||
|---|---|---|---|---|---|---|
| Queens | Workers | Queens | Workers | Workers: Queen present | Workers: Queen not present | |
| N | 46 | 91 | 31 | 49 | 26 | 23 |
| Number of females with ds < 0.5 | 4 | 40 | 2 | 21 | 12 | 9 |
| Number of females 0.5 < ds < 1 | 4 | 15 | 9 | 13 | 7 | 6 |
| Number of females with ds > 1 | 38 | 36 | 20 | 15 | 7 | 8 |
| % with developed ovaries | 93.4 | 60.4 | 96.8 | 73.4 | 73.1 | 69.6 |
| % mated | 91.3 | 46.1 | 100 | 77.5 | 75.0 | 80.0 |
| Average amount of ovarian development | 1.429 +/- 0.765 | 0.913 +/- 1.070 | 1.185 +/- 0.668 | 0.648 +/- 0.673 | 0.625 +/- 0.458 | 0.793 +/- 0.842 |
Halictus farinosus was studied at Green Canyon in the 1970s by
A combination of temperature and rainfall patterns explain variation in phenological events in Halictus farinosus between 2002 and 2010: major events in the colony cycle coincide well with the number of degree days accumulated, with the first adult brood emerging at around 500 degree days (by equation (2), Figure 6). However, in 1976 and 1977 minimum temperatures were much higher and a larger number of degree days had accumulated before workers emerged (800 and 600 days respectively, Figure 6).
The amount of rainfall may have been responsible for the differences in emergence dates between years and the poor correlation with degree day accumulation. Brood development and emergence dates (Table 1) were delayed about two weeks in 2010 compared to 2002 (
Despite the differences in phenology and weather patterns between 2002 and 2010, there were no significant differences in brood size in either brood producing period. More brood were produced per working female in 2010 than in 2002 but this likely reflects differences in the excavation schedule between the two years given that a greater proportion of nests were excavated later in the season in 2010 when more brood and fewer workers were present.
Differences in weather patterns may account for the disparity in caste size dimorphism between years. Weather was much harsher in the spring of 2010 with more rain and colder temperatures compared to 2002 (Figures 4, 5, 6). Poor spring weather conditions may have led to smaller workers being produced in 2010 compared to 2002, as found for a congeneric species by
A much greater percentage of workers in 2010 were found to be mated compared to 2002 and ovarian development in workers was comparable between years (Table 4). This result is unexpected as the workers would be predicted to be less fertile when the queen-worker size differential is larger and queens presumably have more control (
Phylogenetic data, both morphological (
Halictus farinosus produces a small number of workers and has low to moderate worker-queen size dimorphism compared to other social Halictus species (Table 5). It also has a comparatively large number of worker females that are mated and/or have ovarian development, but this varies widely between years. Small size dimorphism, the small number of workers and high degree of mating and ovarian development in workers indicates that the level of sociality in Halictus farinosus is relatively weak compared to that in other social Halictus species (
Comparison of aspects of sociality and natural history in social species of the subgenus Halictus.
| Halictus farinosus | Halictus rubicundus | Halictus ligatus | Halictus sexcinctus | |
| First brood size | 3.5–3.6 | 4.4 | 5.8–> 9 | 7–8.5 |
| Second brood size | 13.0–13.5 | 10.5 | 10–16 | 4.9–5.8 |
| First brood sex ratio | 5–15% | 10.3% | 5.5–14% | 23% |
| % workers with ovarian development | 60.4–77.4% | N/A | 57.16% | 73.70% |
| % workers mated | 46.1–77.5% | N/A | 42% | 56% |
| Queen-worker size dimorphism | 6.4–8.6% | 9.6% | 12.7% | 6.9–11.8% |
| Source | Sellars, 2004; Present study | Soucy, 2002 (social populations) | Packer, 1986; Richards and Packer, 1995 | Richards, 2001 |
This work was funded by an NSERC discovery grant awarded to Dr. Laurence Packer and the junior author’s salary. We thank Terry Griswold and David Trew for their assistance and advice regarding field methodology. We also thank Cory Sheffield, Jessica Albert and two anonymous reviewers for their helpful comments on the manuscript.
Table S1: Excavation details for all nests. (doi: 10.3897/JHR.32.4646.app. File format: Adobe PDF file (pdf).
Explanation note: Table listing all excavated nests, the date of excavation and a breakdown of their brood contents by developmental stage.