


Citation: Silva GR, Souza BA, Pereira FM, Lopes MTR, Valente SES, Diniz FM (2014) New molecular evidence for fragmentation between two distant populations of the threatened stingless bee Melipona subnitida Ducke (Hymenoptera, Apidae, Meliponini). Journal of Hymenoptera Research 38: 1–9. doi: 10.3897/JHR.38.7302
For a snapshot assessment of the genetic diversity present within Melipona subnitida, an endemic stingless bee distributed in the semi-arid region of northeastern Brazil, populations separated by over 1, 000 km distance were analyzed by ISSR genotyping. This is a prerequisite for the establishment of efficient management and conservation practices. From 21 ISSR primers tested, only nine revealed consistent and polymorphic bands (loci). PCR reactions resulted in 165 loci, of which 92 were polymorphic (57.5%). Both ΦST (ARLEQUIN) and θB (HICKORY) presented high values of similar magnitude (0.34, p<0.0001 and 0.33, p<0.0001, respectively), showing that these two groups were highly structured. The dendrogram obtained by the cluster analysis and the scatter-plot of the PCoA corroborate with the data presented by the AMOVA and θB tests. Clear evidence of subdivision among sampling sites was also observed by the Bayesian grouping model analysis (STRUCTURE) of the ISSR data. It is clear from this study that conservation strategies should take into account the heterogeneity of these two separate populations, and address actions towards their sustainability by integrating our findings with ecological tools.
Population differentiation, Hymenoptera, Jandaíra, genetic diversity, ISSR markers
Melipona subnitida Ducke (Hymenoptera, Apidae, Meliponini) is an endemic stingless bee distributed in the Caatinga, the semi-arid region of northeastern Brazil (
The stingless bees are currently threatened by the increasing destruction of native semi-arid vegetation and by the intensification of agriculture in the Caatinga (
Molecular markers have proven to be decisive in elucidating diversity and differences at the DNA level in microorganisms, plants and animals (
The present study uses ISSR analysis to investigate the degree of genetic differentiation between two Melipona subnitida populations separated by over 1, 000 km in the Brazilian Caatinga.
Worker bees were randomly collected from natural colonies (one bee from each of 30 colonies) distributed in 2 locations only: (1) 15 nests in Natal (NAT; coordinates: 5°48'04"S, 35°11'08"W; State of Rio Grande do Norte) and (2) 15 nests in Ilha das Canárias, Parnaíba River Delta (PAR; coordinates: 2°46'39"S, 41°51'59"W; on the border of the states of Piauí and Maranhão) in Brazil (Figure 1A). All the samples were taken to the laboratory and stored at –20 °C until further use. Total genomic DNA was extracted from each adult worker thorax using a phenol/chloroformalcohol isoamyl (25:24:1, v:v:v) extraction of SDS/proteinase-K digested tissue of each individual (
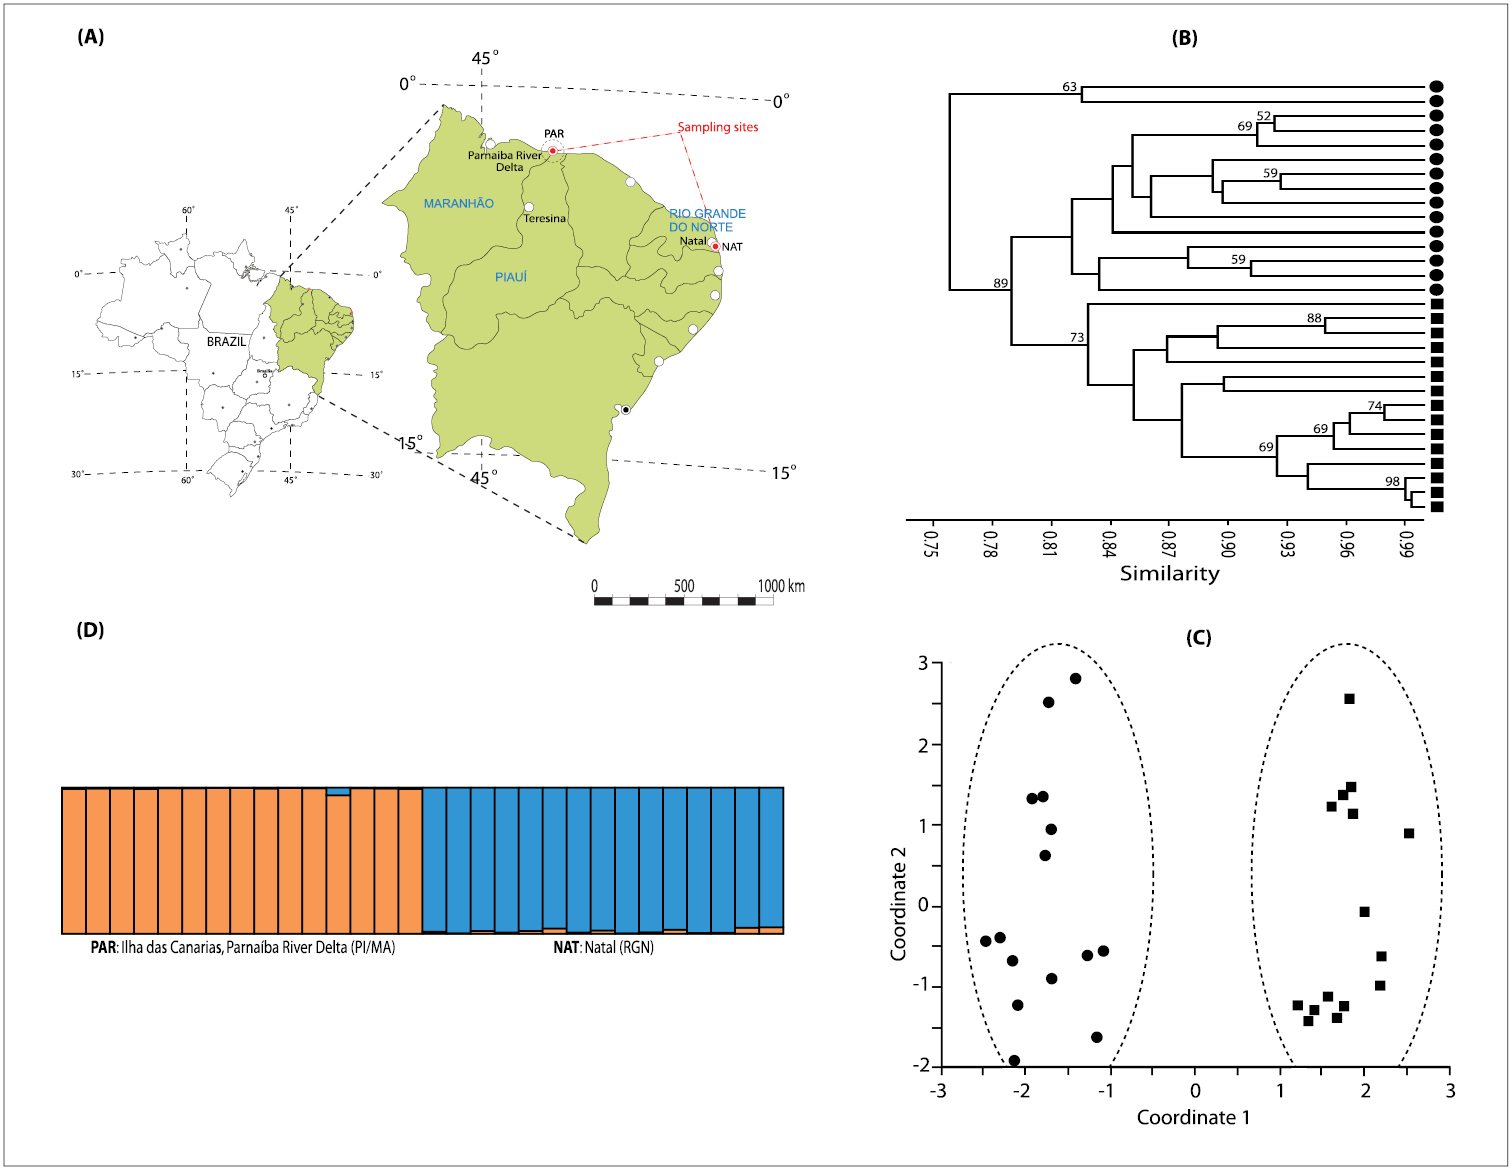
A Sampling sites of Melipona subnitida: NAT (coordinates: 5°48'04"S, 35°11'08"W; State of Rio Grande do Norte) and PAR (coordinates: 2°46'39"S, 41°51'59"W; on the border of the States of Piauí and Maranhão) B Clustering analysis using UPGMA for Melipona subnitida genotypes included in this study based on DICE similarity coefficient values. Numbers indicate bootstrap values for nodes retained by more than 50% of bootstrap replicates (1000 replications) C Scatter-plot of the principal coordinate analysis (PCoA) using ISSR loci. ■ PAR genotypes; ● NAT genotypes D Bar plot from Inferred population structure of using the Bayesian grouping admixture model-based program STRUCTURE (K = 2).
The extracted DNA was then amplified by PCR using twenty-one primers developed by the University of British Columbia (primer set #9). PCRs were carried out in 20 µL-reaction volumes containing approximately 10–50 ng of DNA, 1× PCR buffer (40 mM Tris-HCl; 100 mM KCl), 1.5 µM of primer, 6.25 mM MgCl2, 1.5 µM of each dNTP, 1.25 U of Invitrogen Taq DNA polymerase. All amplifications were carried out on a VERITITM Gradient Thermalcycler (APPLIED BIOSYSTEMS). The following PCR conditions were used: an initial denaturation at 94 °C for 1.5 min, followed by 45 cycles of 94 °C/40 s, 36 °C/1 min. and 72 °C/2 min., and a final extension of 72 °C/5 min. ISSR markers were screened by silver nitrate detection on denatured 6% polyacrylamide gels, which were scored for absence (0) and presence (1) of bands across genotypes and entered into a binary matrix.
Sample polymorphism was estimated as the percentage of polymorphic bands (PPB) in the total number of bands. The program HICKORY v.1.1, which implements the Bayesian method (
Further, a Bayesian grouping admixture model (burn-in length 100, 000 iteractions; run length 100, 000; K = 1 to 8 subpopulations tested) was used to infer the number of subpopulations (software STRUCTURE 2.3.3;
The similarity among samples within populations was estimated using PAST v1.34 (
From 21 primers initially screened for their ability to generate ISSR loci, only nine revealed consistent and polymorphic bands (loci) with 30 Jandaíra worker bees. The other 12 ISSR markers were monomorphic or had unreliable amplification and therefore are not included in the genetic diversity analysis. Polymorphic ISSR primers were also considered reproducible after repeated PCRs, under the same reaction conditions and, therefore, selected for genotyping (Table 1). PCR reactions involving these nine primers resulted in 165 loci (bands) or 18.3 bands/primer, of which 92 were polymorphic (10.2 polymorphic bands/primer) ranging in size from 250 to 1636 bp, corresponding to an average polymorphism of 57.5%. Genotyping showed that most of the detected loci were polymorphic. Overall ISSR polymorphism in Melipona subnitida was similar to that of Melipona quadrifasciata Lepeletier (67%) (
Primer names and sequences used in the ISSR analysis, number of polymorphic bands per primer and range of molecular weight in base pairs (bp) amplified by PCR-ISSR for 30 Melipona subnitida worker bees.
| Primer code | Primer sequence (5’–3’)* | Total number of bands/loci | Number of polymorphic loci | Size range of bands (bp) | |||||
|---|---|---|---|---|---|---|---|---|---|
| Total | Overall PPL | PAR | Polymorphism (%) | NAT | Polymorphism (%) | ||||
| UBC-827 | ACA ACA ACA ACA ACA CG | 15 | 6 | 0.400 | 3 | 50.0 | 6 | 100.0 | 500-1010 |
| UBC-834 | AGA GAG AGA GAG AGA GYT | 25 | 8 | 0.320 | 7 | 87.5 | 2 | 25.0 | 300-1000 |
| UBC-841 | GAG AGA GAG AGA GAG AYC | 21 | 16 | 0.762 | 11 | 68.8 | 13 | 81.3 | 500-1010 |
| UBC-845 | CTC TCT CTC TCT CTC TRG | 9 | 9 | 1.000 | 8 | 88.9 | 8 | 88.9 | 506-1636 |
| UBC-884 | HBH AGA GAG AGA GAG AG | 18 | 5 | 0.278 | 4 | 80.0 | 3 | 60.0 | 500-1010 |
| UBC-886 | VDV CTC TCT CTC TCT CT | 16 | 11 | 0.688 | 6 | 54.5 | 11 | 100.0 | 500-1600 |
| UBC-888 | BDB CAC ACA CAC ACA CA | 14 | 5 | 0.357 | 3 | 60.0 | 4 | 80.0 | 500-1010 |
| UBC-899 | CAT GGT GTT GGT CAT TGT TCC A | 34 | 23 | 0.676 | 14 | 60.9 | 21 | 91.3 | 250-1636 |
| UBC-852 | TCT CTC TCT CTC TCT CRA | 13 | 9 | 0.692 | 3 | 33.3 | 9 | 100.0 | 950-1636 |
| Total | 165 | 92 | - | 59 | - | 77 | - | - | |
| Average | - | - | 0.575 | - | 64.9 | - | 80.7 | - | |
PPL: Proportion of polymorphic loci; *The following designations were used for degenerate sites: Y (C or T), R (A or G), H (A, T, or C), B (G, T, or C), V (C, G, or A) and D (G, A, or T). PAR: Ilha das Canarias, Parnaiba River Delta; NAT: Natal.
ISSR genotyping revealed differences in genetic diversity based on the percentage of polymorphic bands (% PPB), which was also estimated separately for each population. Result suggests that the NAT population (80.7%) is characterized by a higher genetic diversity than the PAR population (64.9%), which in theory might give the NAT population an increased ability to adapt to selective pressures.
The θB, f and HS values obtained from four different models of population structure using the Bayesian analysis are shown in Table 2. Of the models applied to the ISSR dataset, the full model, in which θ and f are estimated simultaneously, was preferred primarily because of its smaller deviant information criterion (DIC) value (657.47), with a difference of more than six units required to indicate strong support over all the other models (
Summary of genetic variability, partitioning of diversity and limits for credible interval by Bayesian statistical procedures.
| Models | f | θB | HS | DIC | ||||||
|---|---|---|---|---|---|---|---|---|---|---|
| Mean | 2.5 % | 97.5 % | Mean | 2.5 % | 97.5 % | Mean | 2.5 % | 97.5 % | ||
| Full | 0.3096 | 0.0455 | 0.67 | 0.3275 | 0.2425 | 0.4188 | 0.2925 | 0.2565 | 0.3254 | 657.465 |
| f = 0 | 0 | - | - | 0.2737 | 0.2099 | 0.3451 | 0.3272 | 0.3122 | 0.3418 | 665.837 |
| θB | 0.3733 | 0.1702 | 0.6037 | 0 | - | - | 0.3546 | 0.3319 | 0.3761 | 1107.250 |
| f-free | 0.4997 | 0.0224 | 0.9742 | 0.3578 | 0.2807 | 0.4389 | 0.2771 | 0.2467 | 0.3098 | 700.287 |
θB is analogous to Wright’s FST, f is analogous to FIS, HS is the average panmictic heterozygosity across populations, and DIC is deviance information criterion.
The analysis of molecular variance also provided additional support to the evidence of population differentiation in Melipona subnitida. The AMOVA analysis indicated that most of the genetic variation found in Melipona subnitida samples could be attributed to differences among individuals within populations (approximately 66% of the variance), but also a large part of the variation (34.35%) was due to differences among localities. The inbreeding coefficient (f = 0.31) provided by HICKORY agrees with the results obtained by the AMOVA, as moderate endogamy might be expected for strongly structured populations.
Both θB (HICKORY) and ΦST (ARLEQUIN) presented high values, but of similar magnitude and significance (0.33, p<0.0001 and 0.34, p<0.0001, respectively), showing that these two populations are highly structured (Tables 2–3). These two different approaches showed a general agreement among the results.
Hierarchical analysis of molecular variance (AMOVA) detected by the ISSR genotyping.
| Source of variation | df | Sum of squares | Variance components | Percentage of total variance (%) | P-value* |
|---|---|---|---|---|---|
| Among populations | 1 | 96.333 | 5.697 | 34.35 | < 0.0001 |
| Among individuals within populations | 28 | 304.800 | 10.886 | 65.65 | 0.014 |
| TOTAL | 29 | 401.133 | 16.583 | ||
| Fixation index | FST index = 0.3435 | ||||
*p-values calculated from a random permutation test (10, 000 permutations).
A high degree of population differentiation has also been observed for Melipona quadrifasciata populations based on ISSR patterns (
Genetic differentiation within Melipona subnitida populations was probably because of low gene flow, caused by limited dispersal ability (
Furthermore, the dendrogram obtained by the cluster analysis (Figure 1B) and the scatter-plot of the PCoA (Figure 1C) revealed a clear separation of the species in two main clusters confirming a significant molecular genetic difference between the two populations. This topology corroborates the data presented by the Bayesian θB and AMOVA. A clear evidence of subdivision among sampling sites was also observed by the Bayesian grouping model analysis of the ISSR data (Figure 1D).
This study provides additional evidence that ISSR markers can be useful tools in defining population genetic substructuring in Melipona species. More importantly, the distinctiveness of populations in these two regions suggests that the NAT and PAR populations of Melipona subnitida have separate evolutionary histories. It is clear from this study that conservation strategies should take into account the heterogeneity of these two separate populations, and that actions should be addressed towards their sustainability by integrating our findings with ecological tools. Failing to do so would risk decimating the entire bee population by uncontrolled human activities in the region.
The authors are grateful to Mr. José Maria Vieira-Neto for help in field collection. This work was supported by grants from the Northeast Bank of Brazil (BNB/ETENE/FUNDECI) and Embrapa (Macroprograma 2, SEG Code: 02.11.01.029.00.00).